- Home
- :
- All Communities
- :
- Products
- :
- Imagery and Remote Sensing
- :
- Imagery Questions
- :
- Raster Classified values are not the same as Stret...
- Subscribe to RSS Feed
- Mark Topic as New
- Mark Topic as Read
- Float this Topic for Current User
- Bookmark
- Subscribe
- Mute
- Printer Friendly Page
Raster Classified values are not the same as Stretched values
- Mark as New
- Bookmark
- Subscribe
- Mute
- Subscribe to RSS Feed
- Permalink
- Report Inappropriate Content
Good afternoon,
We are trying to visualise a Raster dataset (it's a Digital Surface Model [DSM], if it helps), but we are noticing that the Classified Values and the Stretched Values (obtained via the Symbology Tab) are not the same. Any idea as to why this is occuring and which set of values portrays the actual highest/lowest values of the dataset?
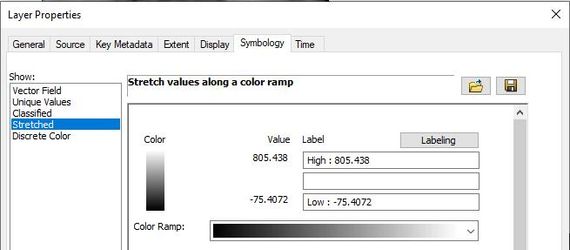
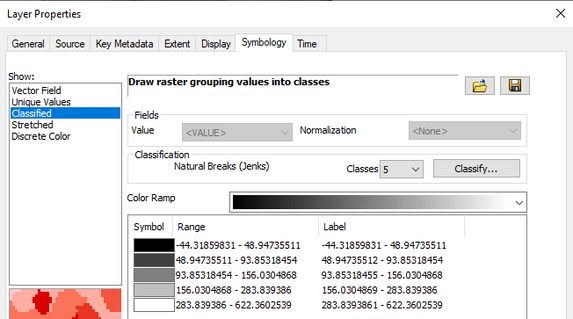
Screenshots below of Classified/Stretched Values via Symbology:
As can be seen, the values from Stretched Symbology range from -75.4 to 805.4, whilst those obtained via Classified Symbology range from -44.3 to 622.4
Thanks in advance,
Claudia
- Mark as New
- Bookmark
- Subscribe
- Mute
- Subscribe to RSS Feed
- Permalink
- Report Inappropriate Content
When using the Classify Render, it uses a estimating technique to be able to quickly use all the (estimated) values. Usually it works fine, but in some cases - especially when there are a few outliers, this estimation is not as helpful.
To use all the actual values, you can use a registry key to forego the estimation. However, be warned that it may take a long time for very large rasters.
https://support.esri.com/en/technical-article/000010263

