- Home
- :
- All Communities
- :
- Products
- :
- Imagery and Remote Sensing
- :
- Imagery Questions
- :
- How to create a 'historic' DSM?
- Subscribe to RSS Feed
- Mark Topic as New
- Mark Topic as Read
- Float this Topic for Current User
- Bookmark
- Subscribe
- Mute
- Printer Friendly Page
How to create a 'historic' DSM?
- Mark as New
- Bookmark
- Subscribe
- Mute
- Subscribe to RSS Feed
- Permalink
- Report Inappropriate Content
Hi,
I'm a new user of ArcGIS, and I hope that someone can help me with my query.
I'm trying to create a DSM for viewshed analysis in 10.4.1 which has 1940s above-ground features for an 8km x 10km area in the UK. In short, I want to be able to 'subtract' areas from a LiDAR DSM which weren't there 70 years ago (mostly modern urban development), and perhaps 'add' elevation data in some areas where woodland used to exist, but has been cleared in recent years.
I have 2m LiDAR DSM and DTM ascii data tiles for the area, that I have mosaic'd to create rasters. I understand that if I subtract the DTM from the DSM I am left with a layer that just has the above-ground features, and it seems to me that it is this new layer that I should be working on to create my historic DSM. However, I'm not sure how to go about it. I can obtain the differences in elevation data easily enough by overlaying a modern map with a historic one, but I'm scratching my head over the best way to reflect these elevation changes in my model. The landscape hasn't changed that much since 1940, so using a modern DSM as the base, and mapping the differences, seems to make more sense than starting from scratch with a bare earth raster and adding all of the many above-ground features (buildings, woodland, hedges, etc) that were there in 1940.
Is this a viable method? If so, I'd be very grateful if someone could briefly explain how best to go about it.
Many thanks in advance for all suggestions.
Paul
- Mark as New
- Bookmark
- Subscribe
- Mute
- Subscribe to RSS Feed
- Permalink
- Report Inappropriate Content
Could you move your question to https://community.esri.com/community/gis/imagery-and-remote-sensing?sr=search&searchId=67d72931-6ff8... space?
- Mark as New
- Bookmark
- Subscribe
- Mute
- Subscribe to RSS Feed
- Permalink
- Report Inappropriate Content
As you mentioned, you can calculate the difference between the DSM and the DTM to obtain the current object heights. When you do so, you may encounter some pixels with negative values which will represent errors in your data, since an object height should not be negative. To avoid these errors in your object height raster, you could use the Raster Calculator—Help | ArcGIS Desktop and apply some correction (setting those pixels to 0) in the calculation like:
Con((DSM - DTM)<0, 0, DSM - DTM)It is always a good things to see how often and where these cases exist to get a better understanding of the quality of your data.
You want to model the landscape as it was 70 years ago and I understand that you want to do that using the resolution of 2m per pixel.You will need to have information on what buildings existed 70 years ago and which buildings did not. In case you have access to the building footprints and know which buildings did not exist 70 years ago you can "filter" those building out. It does not really matter if you change the object height raster and add that one to the DTM to van the DSM for 1940 or that you perform a calculation that will assign the DTM values when a building did not exist and maintain the DSM values when it did.
Since you work with 2m resolution, there will be a reasonable level of detail in your data. The largest challenge may be to obtain information on the 1940 situation when a building did not exist at that time. What was there, was it bare earth (DTM) or was there vegetation or maybe there was a building with a different size and shape. Do you have information on that?
- Mark as New
- Bookmark
- Subscribe
- Mute
- Subscribe to RSS Feed
- Permalink
- Report Inappropriate Content
Many thanks Xander, particularly for the tip about negative data.
I have fairly good data on what was there in 1940, and what was not, from detailed maps of the time.
I hadn't thought about altering the 'difference' raster directly by filtering out areas with positive values. Could you please advise what tool I would use to do that?
Abdullah, I'm reluctant to move the post now that I've had a response - unless you advise me that it won't make any difference.
Many thanks both
Paul
- Mark as New
- Bookmark
- Subscribe
- Mute
- Subscribe to RSS Feed
- Permalink
- Report Inappropriate Content
Hi Paul - Thanks for asking your questions and welcome to the GeoNet community! I wanted to let you know that we're moving your question to the https://community.esri.com/community/gis/imagery-and-remote-sensing?sr=search&searchId=1f6ea6eb-4f61... space so our Esri and user subject matter experts can further help answer this and future questions. So you're aware on how and where to post your questions, here's a few quick tips and reminders:
- First, use the GeoNet search (top right corner by your profile icon) to search and see if your question has already by asked/answered previously
- If not, than we suggest reviewing the GeoNet Community Structure, to find the most relevant space to post your question.
- The GeoNet GeoNet Help group is for questions and tips on how to use the GeoNet community platform not the Esri ArcGIS platform. Following steps 1 & 2 above will give you the best results for getting Esri product questions answered.
- This GeoNet 101 "How to Ask Questions on GeoNet" post is also a helpful guide to asking questions: https://community.esri.com/community/help-and-feedback/blog/2016/08/15/community-news-and-tips-how-t...
Thanks again for contributing and I hope this helps and let us know if you have any questions.
- Mark as New
- Bookmark
- Subscribe
- Mute
- Subscribe to RSS Feed
- Permalink
- Report Inappropriate Content
Many thanks Christopher. I was having difficulty working out this forum structure!
- Mark as New
- Bookmark
- Subscribe
- Mute
- Subscribe to RSS Feed
- Permalink
- Report Inappropriate Content
Paul
Just a few bits of high level advice.
First, you mention mosaicking but I expect you mean you combined multiple files into a single output file, perhaps using the mosaic to new raster (data management) geoprocessing tool. Before you go too far with that, I want to encourage you to look at the Mosaic Dataset, which allows you to make a virtual mosaic. The key is that it will be editable, you can overlay and combine different layers, and you won't have to be creating multiple backups and carefully tracking every edit just in case something goes wrong.
This may be usable if you're only doing relatively gross changes such as removing buildings and adding an estimated DSM height for old tree canopy inside a polygon where you have a historic photos to show trees that have been cut down.
However if you're going to try to do more detailed work, such as trying to replicate the canopy of individual trees, the raster format is going to be very challenging (and I think ultimately unsuccessful) because we don't have tools for efficiently editing small regions. For an "authoritative" surface model, I recommend customers use our Terrain Dataset which is a TIN, not a raster. This will require you convert your 2.5D surface models to points. This is normally applied to bare earth DTMs, but in your case could also process your DSMs. you might want to start here Building a terrain dataset using the New Terrain wizard—Help | ArcGIS Desktop and I believe the Raster to Point GP tool should work to get your DSM & DTM into point format, although I have never actually tried to do this...
Cody B.
- Mark as New
- Bookmark
- Subscribe
- Mute
- Subscribe to RSS Feed
- Permalink
- Report Inappropriate Content
I like the suggestions provided by Cody Benkelman , but I also think this may require a substantial amount of time. However, if you want to obtain a high level of detail and model 1940 to perfection, any method you choose will require a lot of time. Think about canopy as Cody already mentioned or a river that may have changed its course (or was turned into a canal) or a building that no longer existed which height needs to be modeled for the DSM in 1940.
To elaborate a bit about the methods and tool you could use to "filter" buildings and to show some deficiencies of the method I have simulated a small example:
Let's say that the image below shows the 2017 DSM (I used a small part of open AHN3 data from the Netherlands with 0.5m resolution):
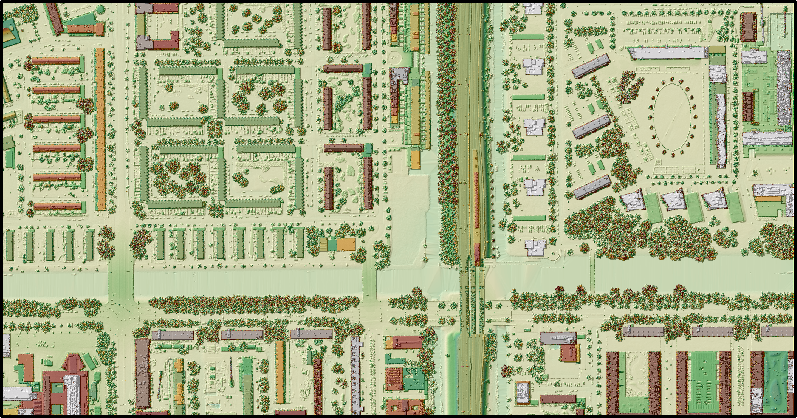
The image below shows the 2017 DTM of the same area:

From another open dataset (BAG) I have my building classified to show which existed in 1940 (green) and which ones were constructed after 1940 (red) and need to be filtered:

In this case you can use the Raster Calculator to apply a formula that will replace the DSM2017 values by the DTM2017 when a building did not exist in 1940 (red buildings):

When you look at the result in detail you will see things like this:

Pixels near to the building footprints will have high values, yet those should have been removed (not to mention the canopy that will have likely changed over the years). In order to do that you can Expand the buildings to enlarge the areas to be altered (in the example below 0 and 1 values represent the buildings):

The result is a raster where the building footprints have been expanded:

If we repeat the raster calculation:

The result is this:

A bit better, but still not what is very realistic (mainly due to canopy). We could also create a polygon that represents the area that has been changed and set the entire area to the DTM value:

In this case the formula will be simpler("newarea" is a raster created from the polygon area):

The result will be like this:

If you have to include elements that existed in 1940 and no longer are in the DSM data, you will have to model them and include them in the resulting raster.
Maybe you can show a screen capture of the data you have that represents the situation in 1940 to see what you are facing...
- Mark as New
- Bookmark
- Subscribe
- Mute
- Subscribe to RSS Feed
- Permalink
- Report Inappropriate Content
Many thanks Xander (and Cody). I have it in mind to use the polygon method to reduce the entire area of urban development that was not there in 1940 to a 0 value, and to combine the two rasters. I will let you know how I get on.
- Mark as New
- Bookmark
- Subscribe
- Mute
- Subscribe to RSS Feed
- Permalink
- Report Inappropriate Content
To Cody and Xander, and others who kindly helped, I got Xander's idea of using polygons to change the value in the above-ground raster (created from substracting the DSM from the DTM) to work. I was then able to add that to the DTM to create the historic landscape.
However, some months later I am replicating the process using higher resolution LiDAR data, and I've forgotten the exact process I used to replace values in the above-ground raster with those from the polygon raster (some 0, some x metres)!! Of course, I should have noted each step down carefully...
Can anyone please advise? I imagine I will need to use Raster Calculator to replace the values in the above-ground raster where values exist in the polygon raster, but of course many of the cell values in the latter are 'NoData', and I'm not clear on the exact process \ syntax I need to use.
Thanks & rergards
Paul