- Home
- :
- All Communities
- :
- Industries
- :
- Education
- :
- Higher Education
- :
- Higher Education Questions
- :
- Re: Showing data through time
- Subscribe to RSS Feed
- Mark Topic as New
- Mark Topic as Read
- Float this Topic for Current User
- Bookmark
- Subscribe
- Mute
- Printer Friendly Page
- Mark as New
- Bookmark
- Subscribe
- Mute
- Subscribe to RSS Feed
- Permalink
I'm trying to show the increase in the carbon output of each nation through time decade by decade, I have used a table join on the attribute table of a country boundry shape file and plotted the data in individual feature classes
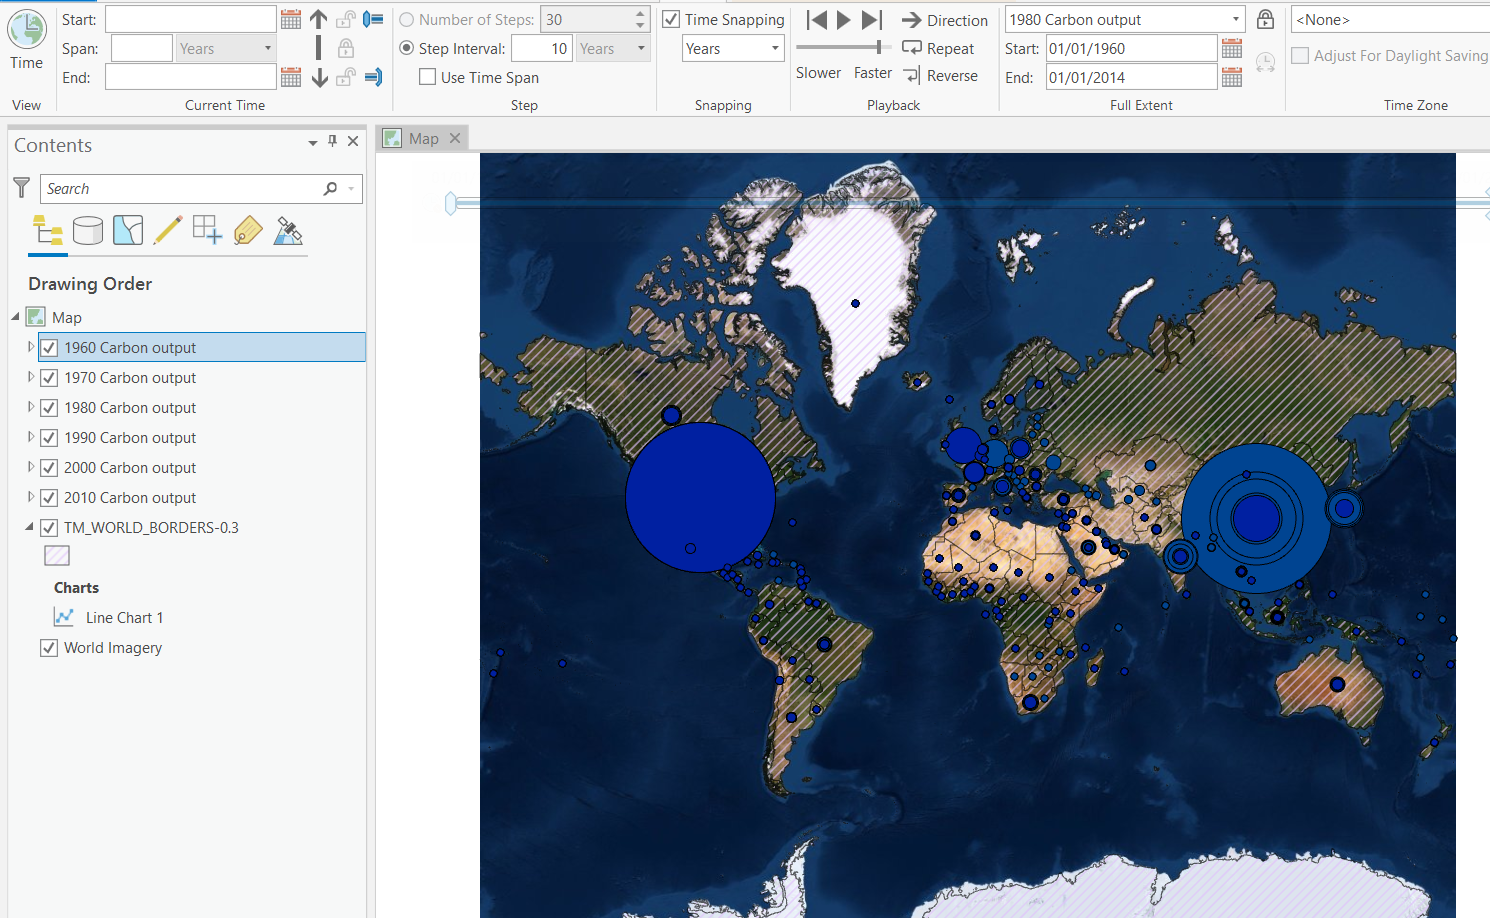
And enabled time on each individual layer, however i'm still having trouble to animate the changes through time
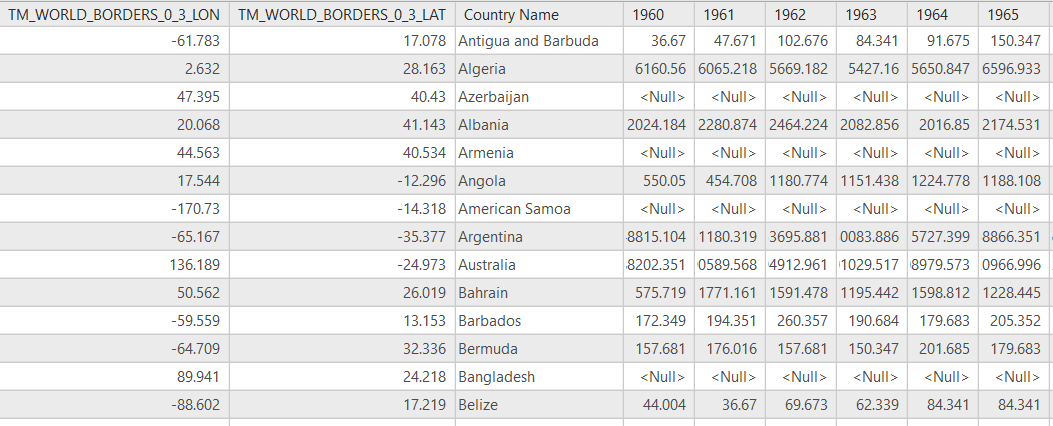
the attribute table for each feature class looks like this
I've looked online but i can't seem to find an answer to my question, any pointers would be very much appreciated
Solved! Go to Solution.
Accepted Solutions
- Mark as New
- Bookmark
- Subscribe
- Mute
- Subscribe to RSS Feed
- Permalink
Transpose Fields can flip your data if you have one field per display year. Transpose Fields—Data Management toolbox | Documentation
I recently created time-enabled school district enrollment maps. My data started out as separate tables; each containing one year's enrollment data for all Wisconsin school districts. Before joining with the spatial data layer, I used the Append tool to combine the tables with a newly created table that was formatted the way I wanted.
- Mark as New
- Bookmark
- Subscribe
- Mute
- Subscribe to RSS Feed
- Permalink
What exactly are you having issues with Daniel?
My first step would be to make the join permanent by saving it as a new feature.
- Mark as New
- Bookmark
- Subscribe
- Mute
- Subscribe to RSS Feed
- Permalink
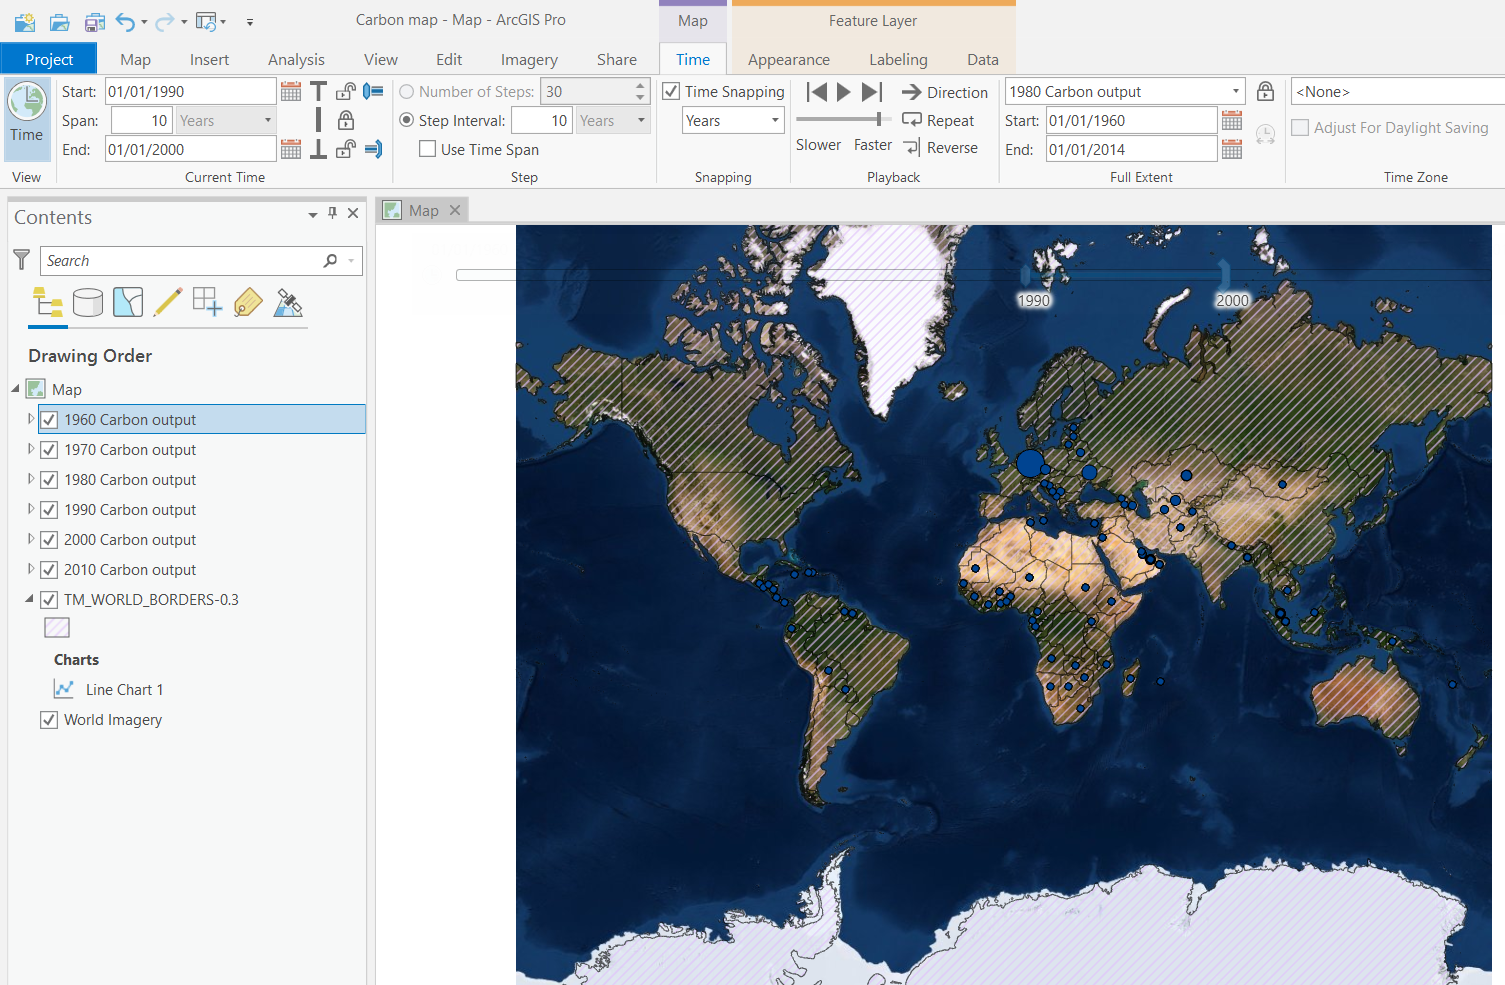
I've saved the classes as a new feature, when i start the time slider the symbology does not change to reflect the new decade i am trying to show, all feature classes are copies of each other just showing a different field from the same attribute table
example of what is happening below:
- Mark as New
- Bookmark
- Subscribe
- Mute
- Subscribe to RSS Feed
- Permalink
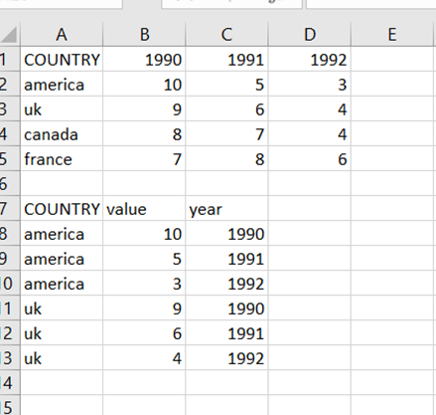
You need the data to all be in one table not multiple, unless you only wish to show it through each decade.
The problem is that time is not read along the columns, you need to replicate a feature for every time.
- Mark as New
- Bookmark
- Subscribe
- Mute
- Subscribe to RSS Feed
- Permalink
Is there a tool that can help with this or will this be a manual process?
many thanks for your help
- Mark as New
- Bookmark
- Subscribe
- Mute
- Subscribe to RSS Feed
- Permalink
I would probably do it with python or other language, there's probably be a simpler way which I'm not aware of (as is mostly the case!)
If you upload a csv of the data I could write it up, or a sample of the schema if you do not wish to send the dataset.
- Mark as New
- Bookmark
- Subscribe
- Mute
- Subscribe to RSS Feed
- Permalink
Hi David
If you'd be willing to i'd be incredibly grateful! there is a transposition tool included in the program but i've spent the last few hours trying to get it to behave and so far had no luck
Here is the link to the data set
https://plymunigis.maps.arcgis.com/home/item.html?id=faf3a3b7c22c495abef104a10ec2519a
please let me know if you have trouble accessing it
Thanks again!
- Mark as New
- Bookmark
- Subscribe
- Mute
- Subscribe to RSS Feed
- Permalink
Transpose Fields can flip your data if you have one field per display year. Transpose Fields—Data Management toolbox | Documentation
I recently created time-enabled school district enrollment maps. My data started out as separate tables; each containing one year's enrollment data for all Wisconsin school districts. Before joining with the spatial data layer, I used the Append tool to combine the tables with a newly created table that was formatted the way I wanted.
- Mark as New
- Bookmark
- Subscribe
- Mute
- Subscribe to RSS Feed
- Permalink
That's an organisational page I cant access