- Home
- :
- All Communities
- :
- Products
- :
- Geoprocessing
- :
- Geoprocessing Questions
- :
- Issues creating Point Density layer
- Subscribe to RSS Feed
- Mark Topic as New
- Mark Topic as Read
- Float this Topic for Current User
- Bookmark
- Subscribe
- Mute
- Printer Friendly Page
- Mark as New
- Bookmark
- Subscribe
- Mute
- Subscribe to RSS Feed
- Permalink
Hello,
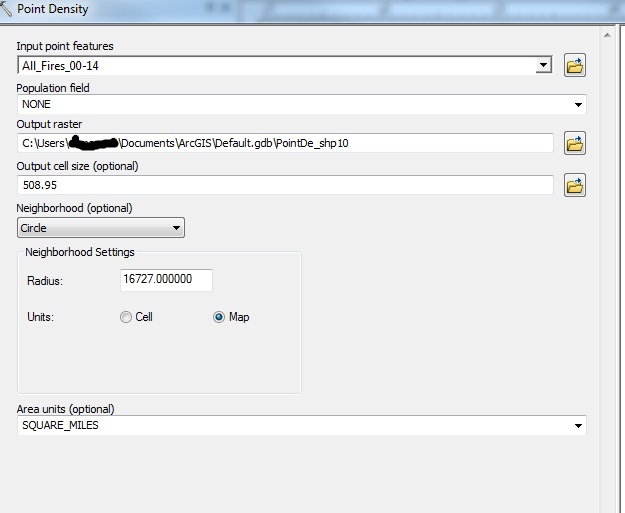
Right now I'm in the process of analyzing some data. I have 4 columns which consist of date, acre size, longitude and latitude. There are over 70,000 records and it's in the form of a shapefile feature class. The data are all points plotted from the X, Y data. I'm trying to map something as simple as the density of the locations of each record per square mile using the Point Density tool, but every time I do it get values of ONLY 0. This is my first time using this tool and I've checked multiple sources on how to use and interpret the tool, but for some reason it's not working properly for me. My map just ends up with a raster layer of entirely 1 color and tells me nothing about the density of the data.
What am I doing wrong?
Also, let me know if I need to clarify on certain points.
Solved! Go to Solution.
Accepted Solutions
- Mark as New
- Bookmark
- Subscribe
- Mute
- Subscribe to RSS Feed
- Permalink
Your data are probably not projected and you used the defaults. The help files gives a strong hint that this will give rise to poor results
Search Result | ArcGIS for Desktop
- project your data
- make a decision on the area you want to calculate density for
- chose your neighborhood appropriately and its radius
- Mark as New
- Bookmark
- Subscribe
- Mute
- Subscribe to RSS Feed
- Permalink
Have you taken a look at the Output cell size and Neighborhood Radius settings? Although the defaults should do this for you, you want to ensure that the minimum distance between your points is "caught" by the Point Density tool.
What version of ArcGIS are you using? Can you provide a screen capture of what your points, tool parameters, and output look like?
- Mark as New
- Bookmark
- Subscribe
- Mute
- Subscribe to RSS Feed
- Permalink
That's what is it looking like right now. I'm using ArcMap 10.3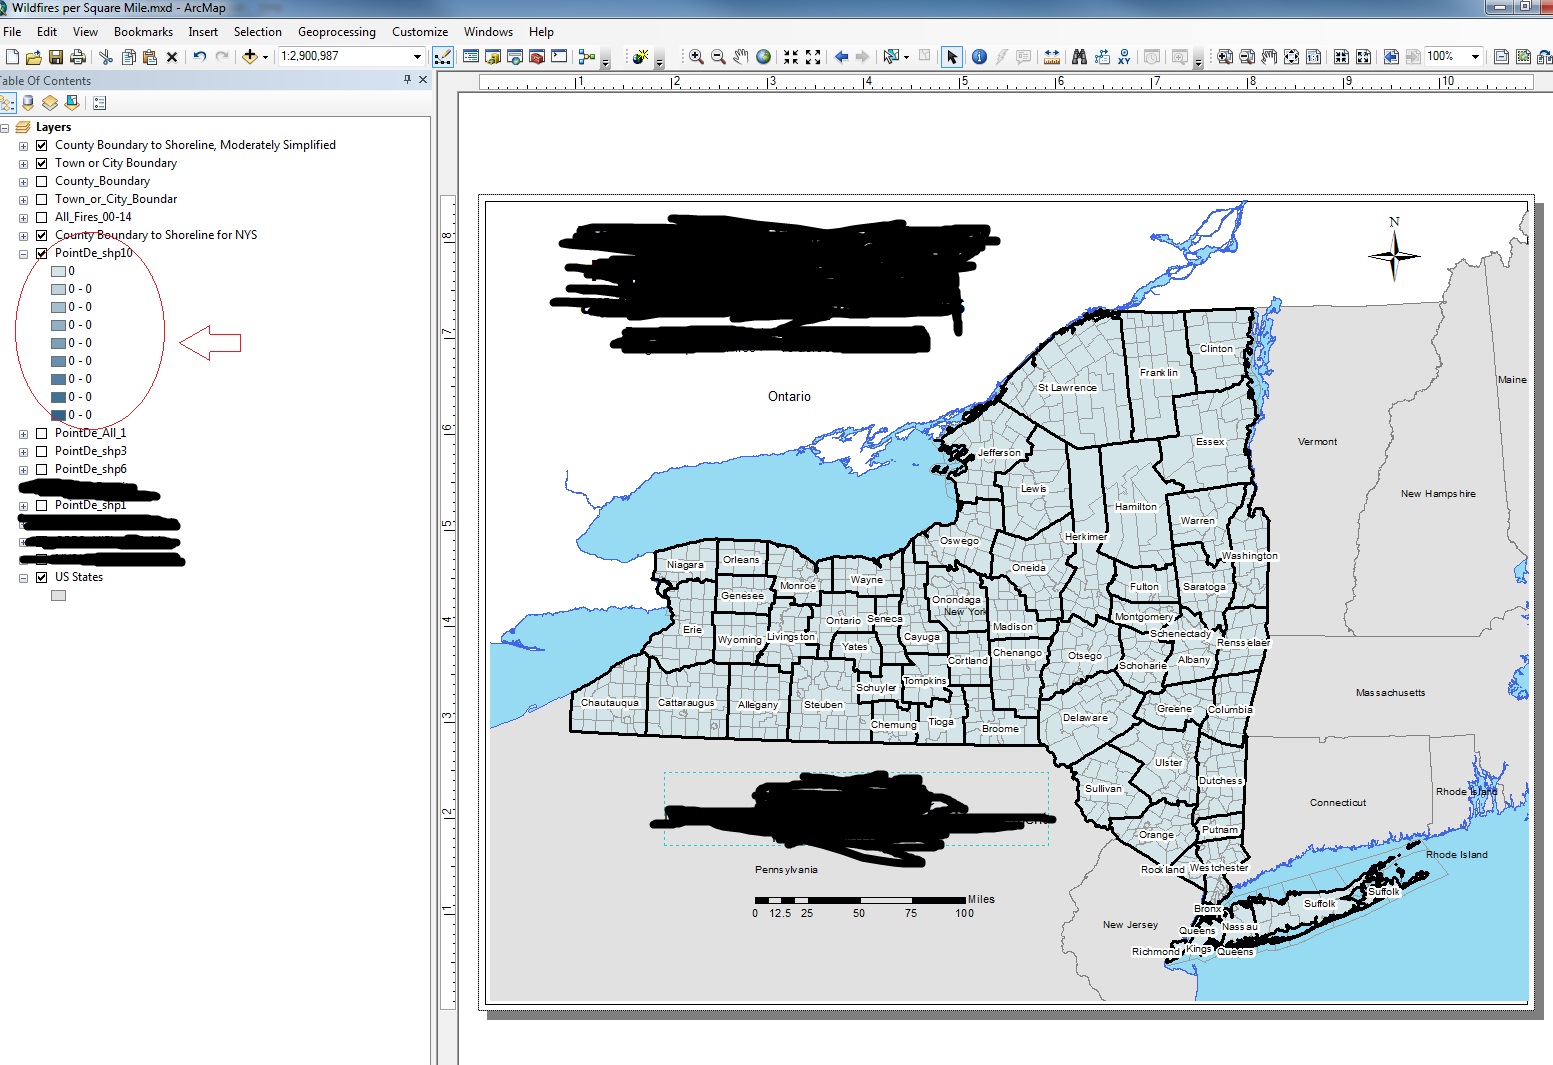
- Mark as New
- Bookmark
- Subscribe
- Mute
- Subscribe to RSS Feed
- Permalink
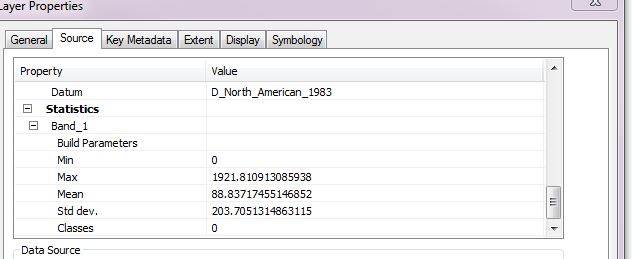
1. Although there is likely no information in the raster, can you take a look in the Layer Properties > Source tab and scroll down to statistics. Are the Min and Max both zero?
2. What does the distribution of your fire points look like?
- Mark as New
- Bookmark
- Subscribe
- Mute
- Subscribe to RSS Feed
- Permalink
They look like this:
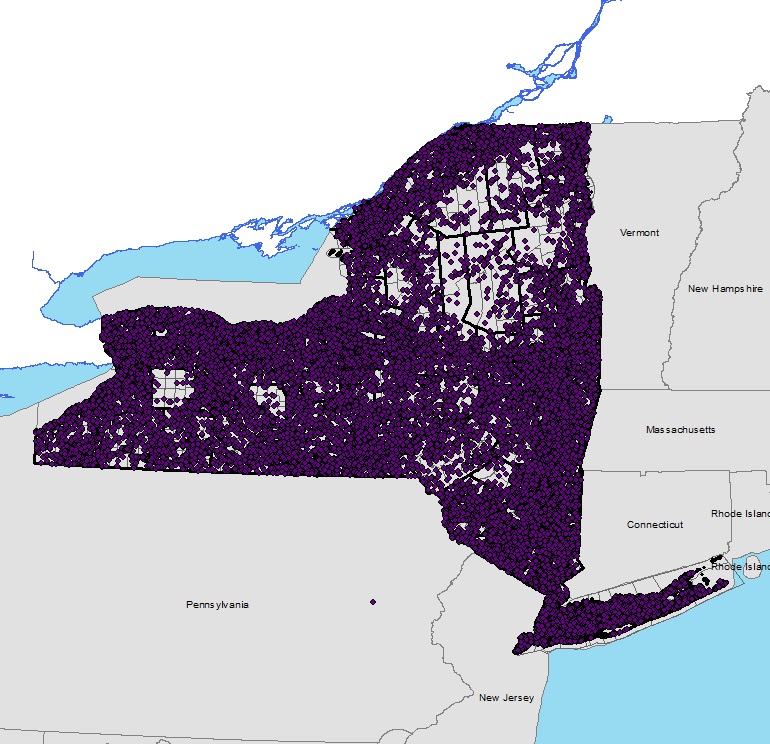
But I actually figured it out! It was a matter of projections and coordinate systems being all screwy.
- Mark as New
- Bookmark
- Subscribe
- Mute
- Subscribe to RSS Feed
- Permalink
What are your map units?
- Mark as New
- Bookmark
- Subscribe
- Mute
- Subscribe to RSS Feed
- Permalink
I'd second Darrens' suggestion - what are the map units? And what coordinate system is being used?
Also, just as a preventative measure, I would set up a File Geodatabase specifically for this project instead of saving to the ArcGIS default geodatabase. Import the shapefile to this project File Geodatabase. Then export the results here also. This will give you more control over the settings for your data.
Chris Donohue, GISP
- Mark as New
- Bookmark
- Subscribe
- Mute
- Subscribe to RSS Feed
- Permalink
Your data are probably not projected and you used the defaults. The help files gives a strong hint that this will give rise to poor results
Search Result | ArcGIS for Desktop
- project your data
- make a decision on the area you want to calculate density for
- chose your neighborhood appropriately and its radius
- Mark as New
- Bookmark
- Subscribe
- Mute
- Subscribe to RSS Feed
- Permalink
Thanks for this! I projected my data to NAD_UTM_Zone_18N, stored all of my data in a file geodatabase and got the result I needed! I followed directions for choosing the radius and neighborhood, but I don't really understand why I chose a circle neighborhood with a cell size of 508.95 and radius of 16727 map units. My map units are in feet and I'm analyzing the map by square miles, so does that mean my radius is 16,727 feet (3.16 mi??) Can you make sense of this? I apologize if this is a silly question. This is my first time using the Spatial Analyst tools.