- Home
- :
- All Communities
- :
- Services
- :
- Esri Training
- :
- Esri Training Questions
- :
- Re: What is the best way to display data with advi...
- Subscribe to RSS Feed
- Mark Topic as New
- Mark Topic as Read
- Float this Topic for Current User
- Bookmark
- Subscribe
- Mute
- Printer Friendly Page
What is the best way to display data with advisories and locations?
- Mark as New
- Bookmark
- Subscribe
- Mute
- Subscribe to RSS Feed
- Permalink
- Report Inappropriate Content
Hi,
I am trying to come up with the best way to display my fish advisory data. I have a couple hundred sites that all have fish consumption advisories for a varying number of species with both an advisory for the general population and high risk population. I am not sure of the best way to represent this data. Any help would be appreciated. Thanks!
- Mark as New
- Bookmark
- Subscribe
- Mute
- Subscribe to RSS Feed
- Permalink
- Report Inappropriate Content
Hi Heidi,
> I am trying to come up with the best way to display my fish advisory data
You may want to take a look at Operations Dashboard for ArcGIS, which is a configurable app to create Dashboards.
Take a look at this example customer Dashboard on a similar topic theme,
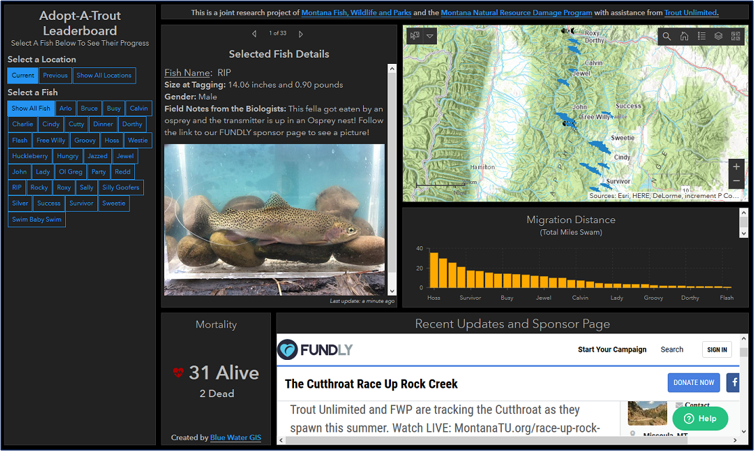
Montana Fish, Wildlife, & Parks - Fish Tracking Dashboard
To learn more about Operations Dashboard, Operations Dashboard for ArcGIS - Useful Links
Hope this helps,