- Home
- :
- All Communities
- :
- Developers
- :
- Developers - General
- :
- Developers Blog
- :
- GeoDev How-to: Design your first custom web mappin...
GeoDev How-to: Design your first custom web mapping app with the ArcGIS Platform
- Subscribe to RSS Feed
- Mark as New
- Mark as Read
- Bookmark
- Subscribe
- Printer Friendly Page
| Data 5% | Design 70% | Code 25% |
|---|
Hello fellow geo developers! In this post we’ll look at how to design and build your first custom web mapping app with the ArcGIS platform. And yes, we are going to build the whole thing from scratch, but don't worry, the whole process shouldn’t take more than about 20-30 minutes.
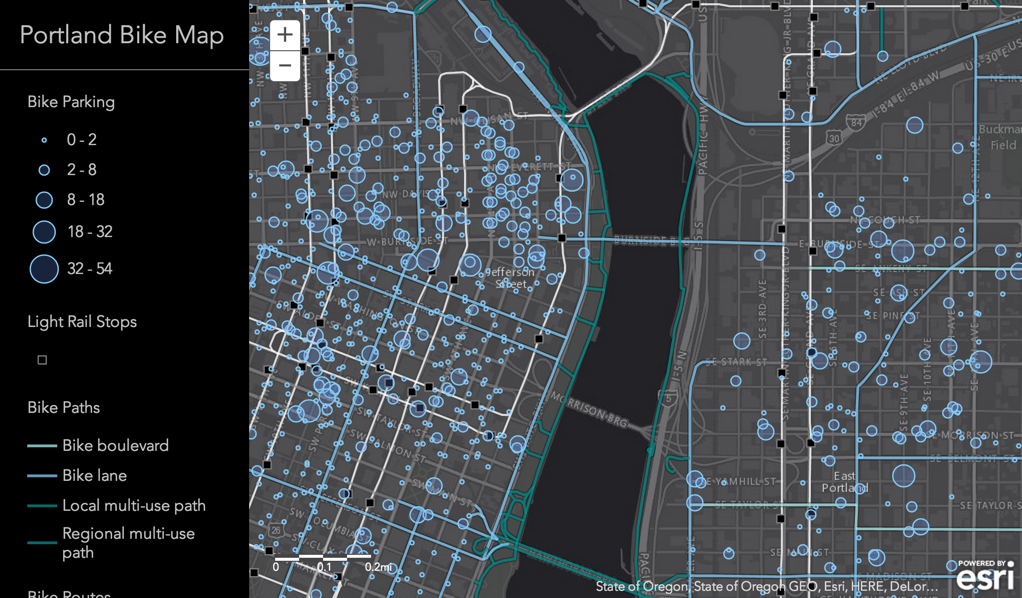
If you just want to jump right to the finished app, you can view it here.
Custom Web Mapping Apps
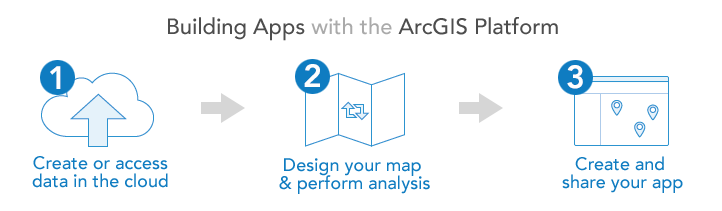
There are a variety of different ways you can build custom web mapping apps with ArcGIS, but one of the easiest ways is to use ArcGIS Online to find data, use the Map Viewer to create and style a map, and then use the ArcGIS API for JavaScript to build the application (see below). This process doesn’t require any installed software and the only thing you need is free ArcGIS Developer account so you can save your maps.
Designing Maps and Apps
One of most important parts of building a mapping app is designing a good map, so that is something we will focus on. This means creating a map that has cartographic symbols and elements that are meaningful, color correct, and most important, are usable at different zoom levels. The map (and app) for this scenario will show bicycle paths, lanes, designated streets and parking locations around the City of Portland.
In this how-to you will...
Step 1: Use ArcGIS Online and the ArcGIS Map Viewer to add some layers to a map.
Step 2: Use the ArcGIS Map Viewer to design a map by changing symbols, setting visibility ranges and configuring popups.
Step 3: Build a custom web app with the ArcGIS API for JavaScript to display the map.
NOTE: If you are new to ArcGIS, please review the getting started article before proceeding.
Step 1: Add data to your map
The first thing we need to do is add some data to the map. Since ArcGIS Online contains a ton of maps and layers that people have already published, we’ll just search for existing bike-related feature layers for Portland and add them to our map. A feature layer is just a vector layer that can be styled easily with the Map Viewer. Learn more about feature layers here.
TIP: If you don’t already have a free ArcGIS Developer or a ArcGIS Organization account, you’ll need to sign up for one now so you can save your map. If you don’t have an account, go to ArcGIS for Developers and sign up for one now. |
Create a new map
Let’s start by searching for a layer and then creating a new map.
- Go to ArcGIS Online > Gallery.
- Click Search (icon) > Portland Bike Parking (Feature Layer by al_geodev).
- Notice there are a few different people who have published parking layers.
- Make sure you use the “Bike Parking” layer published by al_geodev.
- Click Bike Parking > Open > Add Layer to new Map. This opens the Map Viewer.
Save the map
Before we get too far, let’s login and save our map.
- Click Sign In and log into your ArcGIS account.
- Click Save and fill in the following fields:
- Title: Portland Bike Map
- Tags: Portland, Bike, Map
- Summary: Map to help cyclists get around
- Save in folder: <your name>
- Click Save Map.
Add more layers
Now let’s add a few more layers that will help cyclists identify different ways to get around town.
- Click Add > Search for Layers and add the following layers to the map.
- In: ArcGIS Online (Make sure this is checked!)
- Find: “Portland Bike Routes” > Go > Add
- Find: “Portland Bike Paths” > Go > Add
- Find: “Light Rail Lines” > Go > Add
- Find: “Light Rail Stops” > Go > Add
- Click Done Adding Layers.
- Click Add > Search for layers again.
- Find: “Portland Bike Paths” > Go > Add
- Yes, add the same layer twice! You may have to close the window and re-open to add the layer again.
- Click Bike Parking > Drop-Down Arrow
- Click Move Down until the Bike Paths layers are next to one anther.
- Save the map.
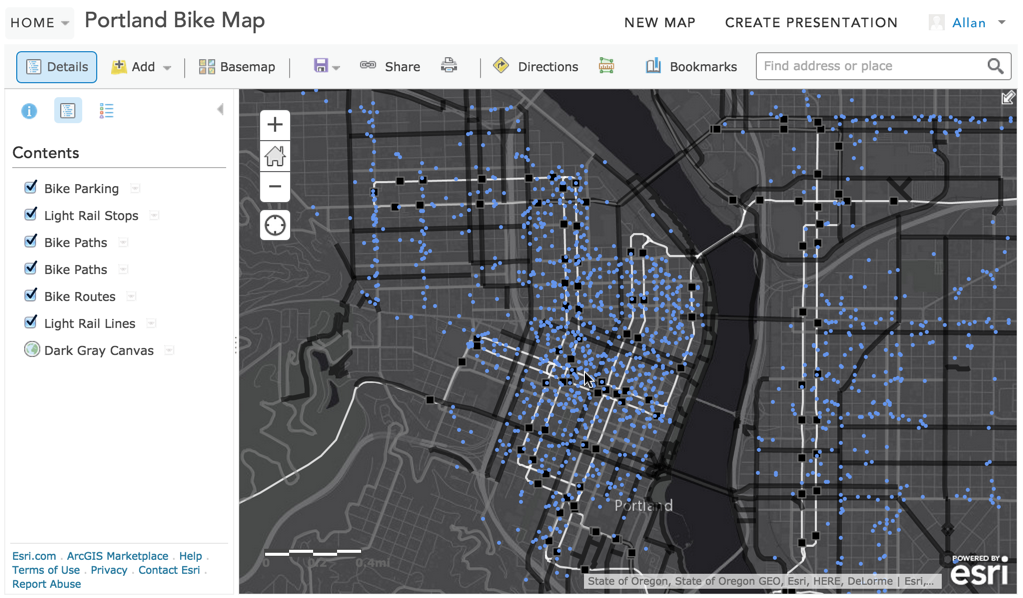
Your map should look something like this. Yikes! These are just the default symbols saved each feature service. We need to override these in our map.

Step 2: Design and style your map
Now that we have some feature layers in our map we can use the Map Viewer to style them. This is a bit of a tedious process, but creating nice cartographic symbols is probably the most important step to make your map (and app) usable. In this step, you will set the basemap, symbols, viewing scales, filters and popups. Learn more about creating and styling maps here.
If you already know how to design and author maps you can jump right to the finished map here.
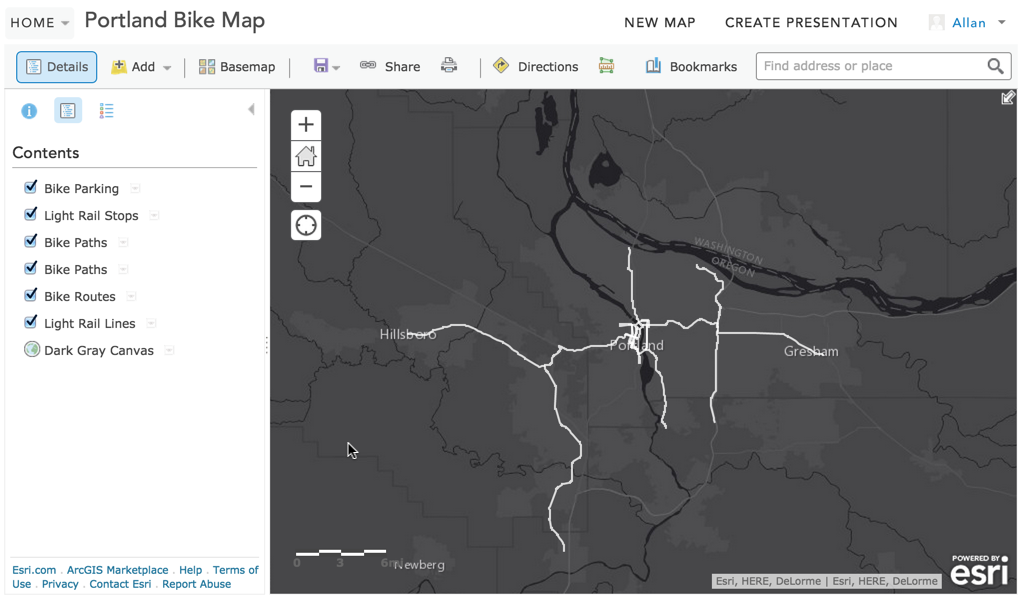
Set the Basemap
- Click Basemap > Dark Gray Canvas. Much better!
- Now zoom in a couple of times and center on downtown Portland.
- Save the map.
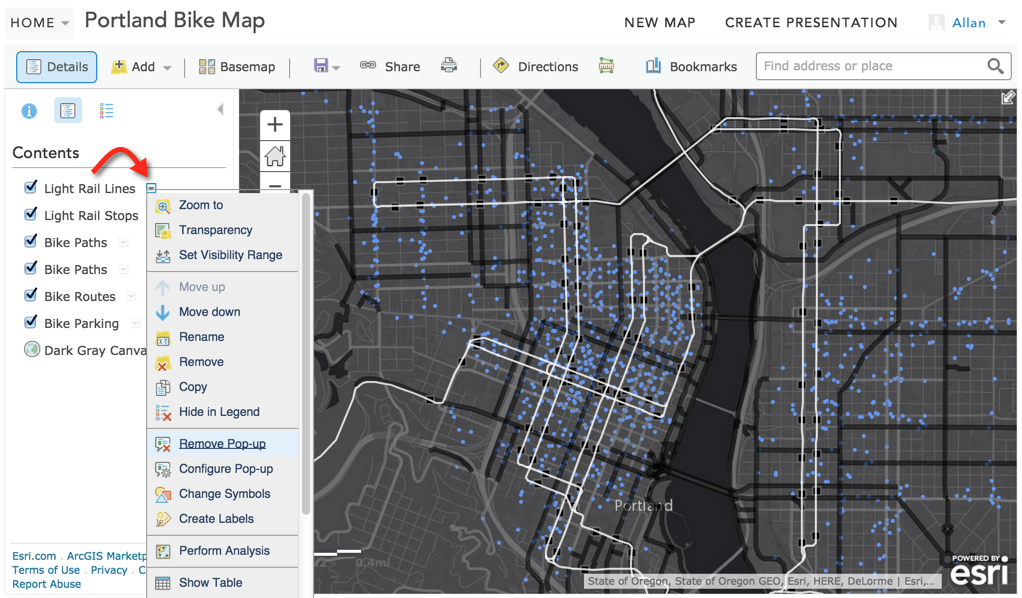
 | TIP: The easiest way to set layer properties is to use the “Drop-Down Arrow” for each layer (see below). With this menu you can configure all aspects of the layer including symbols, pop-ups, and visibility. You will use this extensively in the following steps. |
Reorder the layers
Since bike parking is more important than rail lines, let’s change the order the layers draw.
- Click Bike Parking > Drop-Down Arrow
- Click Move Up until the layer is at the top.
- Click Light Rail Lines > Drop-Down Arrow
- Click Move Down until the layer is at the bottom.
- Save the map.
Style the Bike Parking layer
You may have noticed that there are thousands of bike parking locations, so let’s improve the cartographic symbols by using a size renderer to group parking spots by the number of parking spaces available. We’ll also configure the popup to show this information too. Learn more about changing symbols here.
- Click Bike Parking > Drop-Down Arrow.
- Click Change Symbols > Size and set the following values:
- Use: Size
- To show: NUMSPACES
- By: Natural Breaks
- With: 5 Classes
- Click > Options > Change All Symbols
- Start size: 4px
- End size: 28px
- Color: Cornflower Blue
- Transparency: 75%
- Outline Color: Light Sky Blue
- Outline Width: 1px
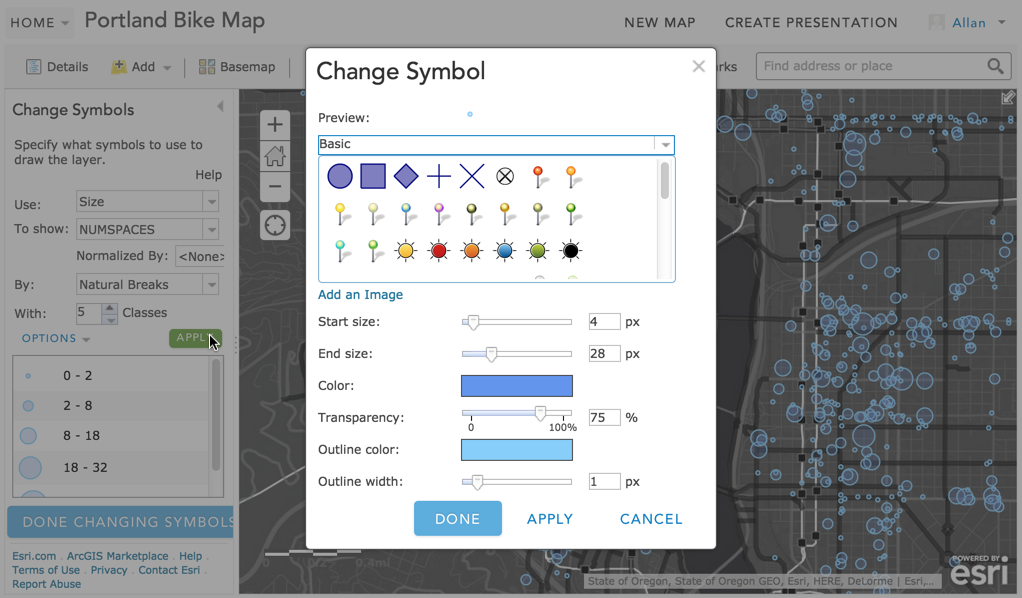
- Click Done > Done Changing Symbols.
- Save the map.
Now style the popup to show the number of parking spaces available in each area.
- Click Bike Parking > Drop-Down Arrow > Configure Popup and set the following:
- Pop-up Title: Bike Parking
- Click Configure Attributes
- Remove all checkboxes
- Check NUMSPACES
- Format: 0 decimal places
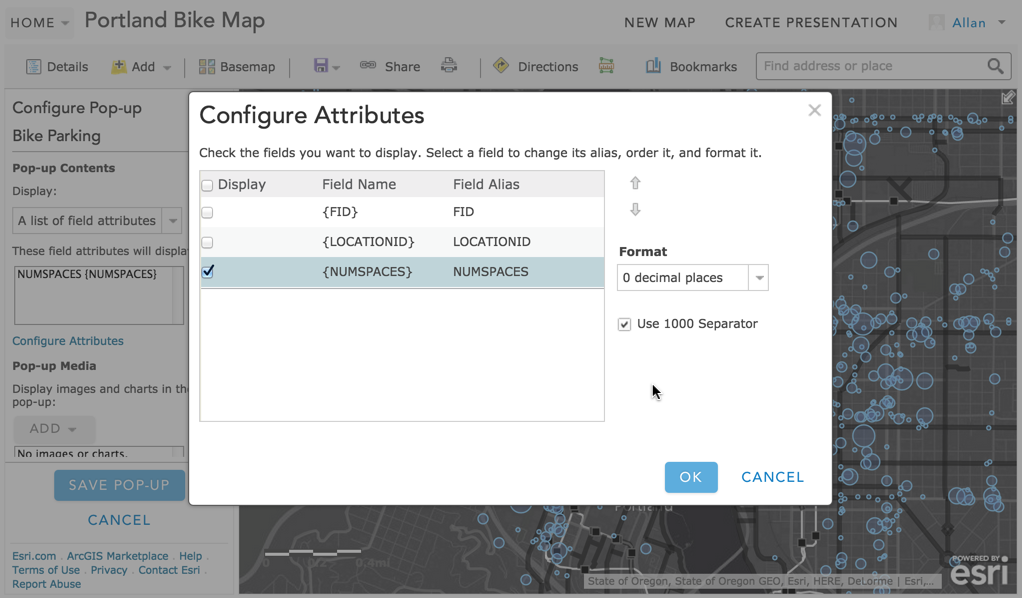
- Click Ok > Save Pop-up.
- Save the map.
- Zoom in and center the map on Portland downtown.
- Test the pop-up.
Style the Light Rail Stops and Light Rail Lines layers
Let’s format the popups for these layers to show the station name, type of train and line.
- Click Light Rail Stops > Drop-down Arrow > Configure Pop-up
- Pop-up Title: Rail Stop
- Click Configure Attributes and set the following:
- Remove all checkboxes
- Check STATION
- Check TYPE
- Check LINE
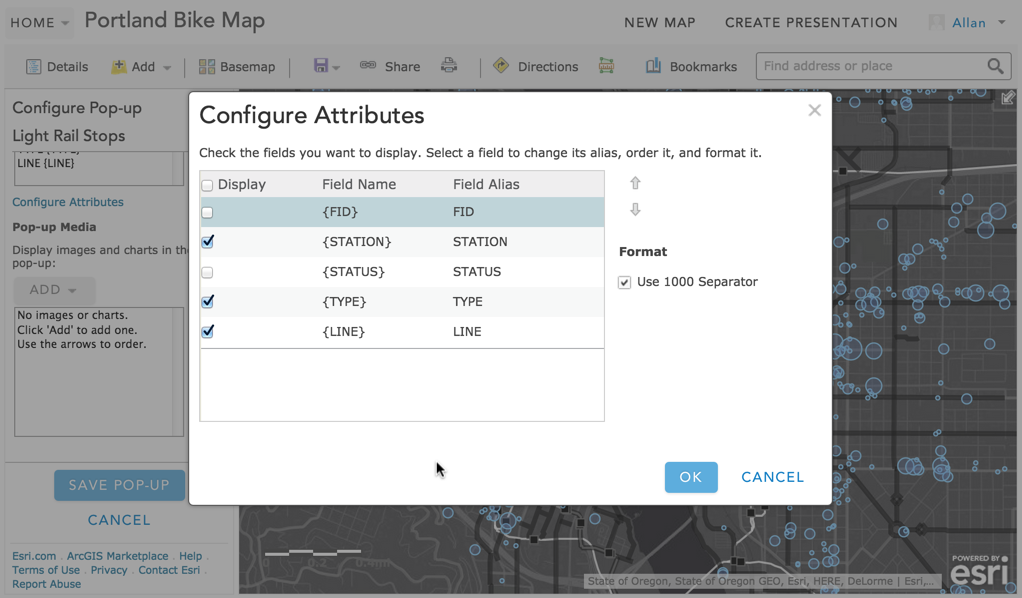
- Click Ok > Save Pop-up.
- Click Light Rail Lines > Drop-down Arrow > Remove Pop-up.
- Save the map.
- Test the popup.
Style the Bike Paths layers
Now let’s set the symbol and popup for the Bike Paths layers so we can easily identify those features. We will need to use a unique renderer to set styles based on attributes for bike paths and lanes. We’ll also use some advanced styling techniques where the first layer will be the inner layer and will represent the different types of paths and lanes and and the second layer will represent the outer layer to create a sharper edge.
- Click the first Bike Paths > Drop-Down Arrow
- Click Change Symbols > Change Symbol > Use and set the following:
- Use: Unique Symbols
- To show: BIKEMODE
- Click the Bike boulevard symbol
- Color: Pale Turquoise
- Pattern: Solid
- Transparency: 25%
- Width: 3px
- Done
- Click the Bike lane symbol
- Color: Light Sky Blue
- Pattern: Solid
- Transparency: 25%
- Width: 3px
- Done
- Click the Local multi-use path symbol
- Color: Dark Cyan
- Pattern: Solid
- Transparency: 25%
- Width: 3px
- Done
- Click the Regional multi-use symbol Lane symbol
- Color: Dark Cyan
- Pattern: Solid
- Transparency: 25%
- Width: 3px
- Done

- Click Done Changing Symbols.
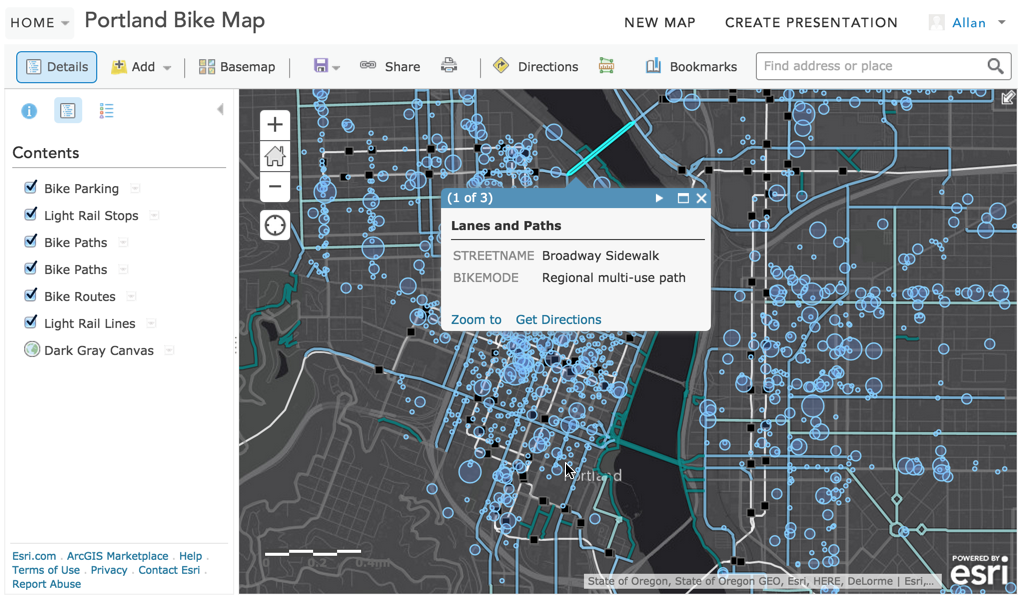
Now let's configure the pop-up.
- Click the first Bike Paths > Drop-Down Arrow > Configure Pop-up
- Pop-up Title: Lanes and Paths
- Configure Attributes > Uncheck all fields and just leave these on:
- STREETNAME
- BIKEMODE
- Click Ok > Save Pop-up.
- Click the second Bike Paths > Drop-Down Arrow > Remove Popup-up.
- Click the second Bike Paths > Drop-Down Arrow > Hide in Legend.
- Save the map.
- Test the symbols and pop-us by clicking on the bike paths. Also check the legend to make sure you only have one Bike Paths layer.
Your map should look something like this.
Style the Bike Routes layer
Now let’s show the street name and bike mode for this layer. The bike mode tells us whether the street is high, moderate or low traffic so this will be handy when planning routes.
- Click the Bike Routes > Drop-Down Arrow > Configure Pop-up
- Pop-up Title: Street Route
- Configure Attributes > Uncheck all fields and just leave these on:
- STREETNAME
- BIKEMODE
- Click Ok > Save Pop-up.
- Save the map.
- Test the pop-up.

Remove the Light Rail Lines layer pop-ups
We don’t need the pop-ups for this layer so let’s remove it.
- Click Light Rail Lines > Drop-down Arrow > Remove Pop-up.
- Save the map.
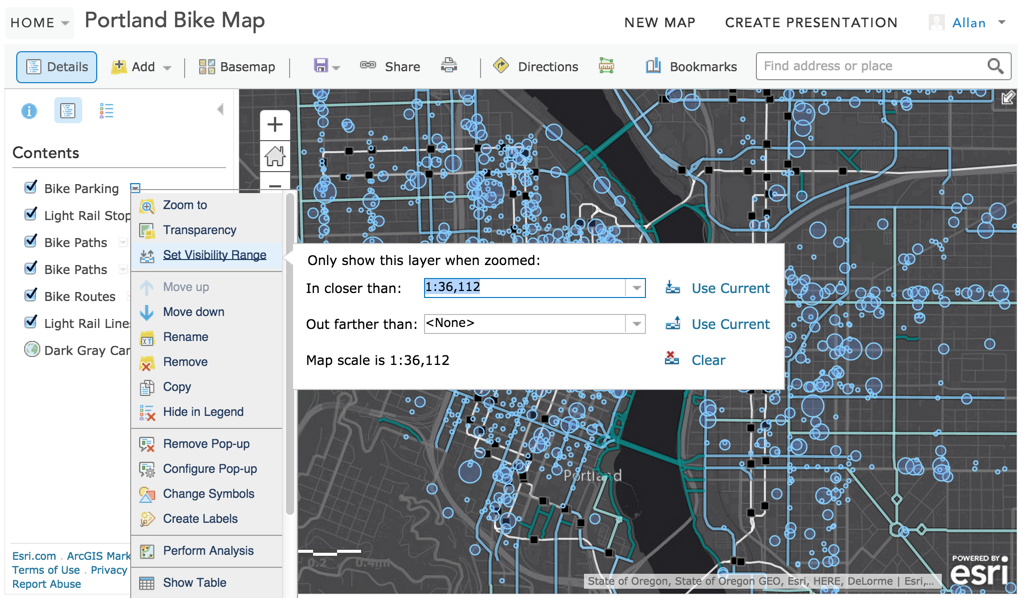
Set the visibility range for each layer
Now that we have our layers styled, let’s declutter things a little by turning layers on and off as we zoom in and out of the map. We can accomplish this by setting each layer’s visibility range.
Bike Parking layer
- Zoom in fairly close to downtown so that the scale bar shows about 0.4 miles.
- Click Bike Parking > Drop-down Arrow > Set Visibility Range:
- In Closer than: 1:36,112 > Use Current
NOTE: Just click on the map to dismiss the window.
- Zoom out one more level. Your scale bar should now show 1 mile.
- Click Light Rail Stops > Drop-down Arrow > Set Visibility Range:
- In Closer than: 1:72,224 > Use Current
- Click on the map to dismiss.
Light Rail Stops layer
- Zoom out one more level. Your scale bar should now show 2 miles.
- Skip down to Bike Routes.
- Click Bike Routes > Drop-down Arrow > Set Visibility Range:
- In Closer than: 1:144,448 > Use Current
- Click on the map to dismiss.
Bike Paths (both layers)
- Zoom out one more level. Your scale bar should show 3 miles.
- For both Bike Paths click Drop-down Arrow > Set Visibility Range:
- In Closer than: 1:288,896 > Use Current
- Click on the map to dismiss.
Light Rail Lines layer
- Zoom out one more level. Your scale bar should show 6 miles.
- Click Light Rail Lines > Drop-down Arrow > Set Visibility Range:
- In Closer than: 1:577,791 > Use Current
- Save the map.
Try zooming in and out to test the preset zoom levels.
Add a label to the map
Using Map Notes you can add text and shapes to your map interactively. Let’s add a label now.
- Click > Add > Map Notes > Create.
- Click on Map Notes - Text > Text
- Click on the right corner of the map > type “Portland Bike Map”.
- Double-click on the label to and change the color to light grey.
- Save the map.

Now test drive the entire map to make sure the zoom levels, pop-ups and symbols are how you want them.
| TIP: At this point, you could deploy the entire map as a pre-built template or a Web AppBuilder app without writing code by selecting Share > Make a web application. We’ll learn how to do this in another tutorial. In our case however, we are going to write a custom JavaScript app from scratch. |
Step 3: Build a custom JavaScript app
The last step is to use the ArcGIS API for JavaScript to build an app that uses your map. If you are new to the JavaScript API, it’s probably a good idea to review the documentation first.
If you want to fast forward to the finished app, go here.
| TIP: Every map that you create and save with the Map Viewer is stored in ArcGIS Online and has a unique ID. This ID is stored as an item in your account. When the map is loaded in the Map Viewer, it’s easy to identify the ID in the URL in your browser.
The great thing about this ID is that you can reference it directly in any custom app that you build. The advantage of doing this is the map will maintain all of its configuration settings as you saved them. For example, all of the map layers, symbols, colors, popup and filter settings will be honored. |

Find your map ID
Identify the ID for your map in your web browser. For example:
http://edn.maps.arcgis.com/home/webmap/viewer.html?webmap=8e42e164d4174da09f61fe0d3f206641
Build your app
Now let’s write the code to load our map. We’ll use three DIV elements to represent different items stored in the map: title, legend, and map. We need to extract each item and then set their location and style on the web page. We'll also use some nice fonts (fast fonts) and a little CSS styling to finish off the rest of the app.
NOTE: This code extends an existing JavaScript tutorial, so if you want more details about the code, go here.
- Go to JSBin to create a new application.
- Copy and paste the code below.
<!DOCTYPE html>
  <html>
  <head>
  <title>Design a Web Mapping App</title>
  <meta http-equiv="Content-Type" content="text/html; charset=utf-8">
  <meta http-equiv="X-UA-Compatible" content="IE=edge">
  <!-- Fonts -->
  <link type="text/css" rel="stylesheet" href="https://community.esri.com//fast.fonts.net/cssapi/3706abc4-0756-424b-b07b-1748122f85d8.css">
  <!-- Reference the ArcGIS JavaScript css library -->
  <link rel="stylesheet" type="text/css" href="http://js.arcgis.com/3.11/esri/css/esri.css">

  <style>
    html,body,#mapDiv {
      padding: 0;
      margin: 0;
      height: 100%;
      overflow: hidden;
    }
    #mapDiv {
      position: absolute !important;
      left: 250px;
      right: 0;
    }
    #sidebar {
      position: absolute !important;
      top: 0;
      bottom: 0;
      width: 250px;
      overflow: hidden;
      color: #c3c3c3;
      background-color: black;
      font-family: "Avenir LT W01 35 Light", Arial, Helvetica, sans-serif;
    }
    #titleDiv {
      position: absolute !important;
      top: 0;
      left: 0;
      right: 0;
      height: 30px;
      padding: 20px;
      border-bottom: rgba(255, 255, 255, 0.5) 1px solid;
      font-size: 25px;
    }
    #legendDiv {
      position: absolute !important;
      top: 90px;
      bottom: 0;
      left: 0;
      right: -15px;
      padding: 0 0 25px 25px;
      overflow: auto;
    }
    .esriLegendServiceLabel {
      font-weight: normal;
    }
    .esriScalebarLabel {
      color: white;
      font-weight: normal;
      font-family: "Avenir LT W01 35 Light", Arial, Helvetica, sans-serif;
    }
    .esriAttribution {
      color: #ddd;
      background-color: transparent;
      font-family: "Avenir LT W01 35 Light", Arial, Helvetica, sans-serif;
    }
  </style>

  <!-- Reference the ArcGIS JavaScript library -->
  <script src="http://js.arcgis.com/3.12/"></script>
  <script>
    require(["esri/map", "esri/arcgis/utils", "esri/dijit/Legend", "esri/dijit/Scalebar", "dojo/domReady!"
      ], function (Map, arcgisUtils, Legend, Scalebar) {

      // Create the map - Replace the map ID with your own map ID!
      arcgisUtils.createMap("8e42e164d4174da09f61fe0d3f206641", "mapDiv").then(function (response) {
        // Get the map
        var map = response.map;

        // Show the title
        var title = document.getElementById("titleDiv");
        title.innerHTML = response.itemInfo.item.title;

        // Show scalebar
        var scalebar = new Scalebar({
          map: response.map,
          scalebarUnit: "english"
        });

        // Show the legend
        var legend = new Legend({
            map: map,
            layerInfos: (arcgisUtils.getLegendLayers(response))
          }, "legendDiv");
          legend.startup();
        });
      });
  </script>

  </head>

  <body>
    <!-- DIV elements for map -->
    <div id="mapDiv"></div>
    <div id="sidebar">
      <div id="titleDiv"></div>
      <div id="legendDiv"></div>
    </div>
  </body>
</html>
3. Now replace the map ID below with the ID for your map.
      // Create the map - Replace the map ID with your own map ID!
arcgisUtils.createMap(<your map ID goes here>, "mapDiv").then(function (response) {- Run the app and presto! You have your first custom JavaScript web app!
Conclusion
So there you have it - your first custom web mapping app in 20-30 minutes! In the end, we learned how to find layers in ArcGIS Online, use the Map Viewer to style map layers, and then use the map in a simple JavaScript app. Be sure to keep your eyes peeled for the next GeoDev tutorial.
If you have feedback, feel free to tweet @AL_Laframboise or @EsriGeoDev and be sure to use #geodev!
Happy Holidays
What’s next?
GeoDev How-to: Getting Started with the ArcGIS Platform for Developers
GeoDev How-to: Design your first custom web mapping app with the ArcGIS Platform
GeoDev How-to: Perform spatial analyses for your mapping app [coming soon]
...
You must be a registered user to add a comment. If you've already registered, sign in. Otherwise, register and sign in.