Turn on suggestions
Auto-suggest helps you quickly narrow down your search results by suggesting possible matches as you type.
Cancel
- Home
- :
- All Communities
- :
- Products
- :
- Data Management
- :
- Data Management Questions
- :
- Understanding mxdperfstat report
Options
- Subscribe to RSS Feed
- Mark Topic as New
- Mark Topic as Read
- Float this Topic for Current User
- Bookmark
- Subscribe
- Mute
- Printer Friendly Page
Understanding mxdperfstat report
Subscribe
5370
2
02-01-2017 12:26 AM
02-01-2017
12:26 AM
- Mark as New
- Bookmark
- Subscribe
- Mute
- Subscribe to RSS Feed
- Permalink
Hi all,
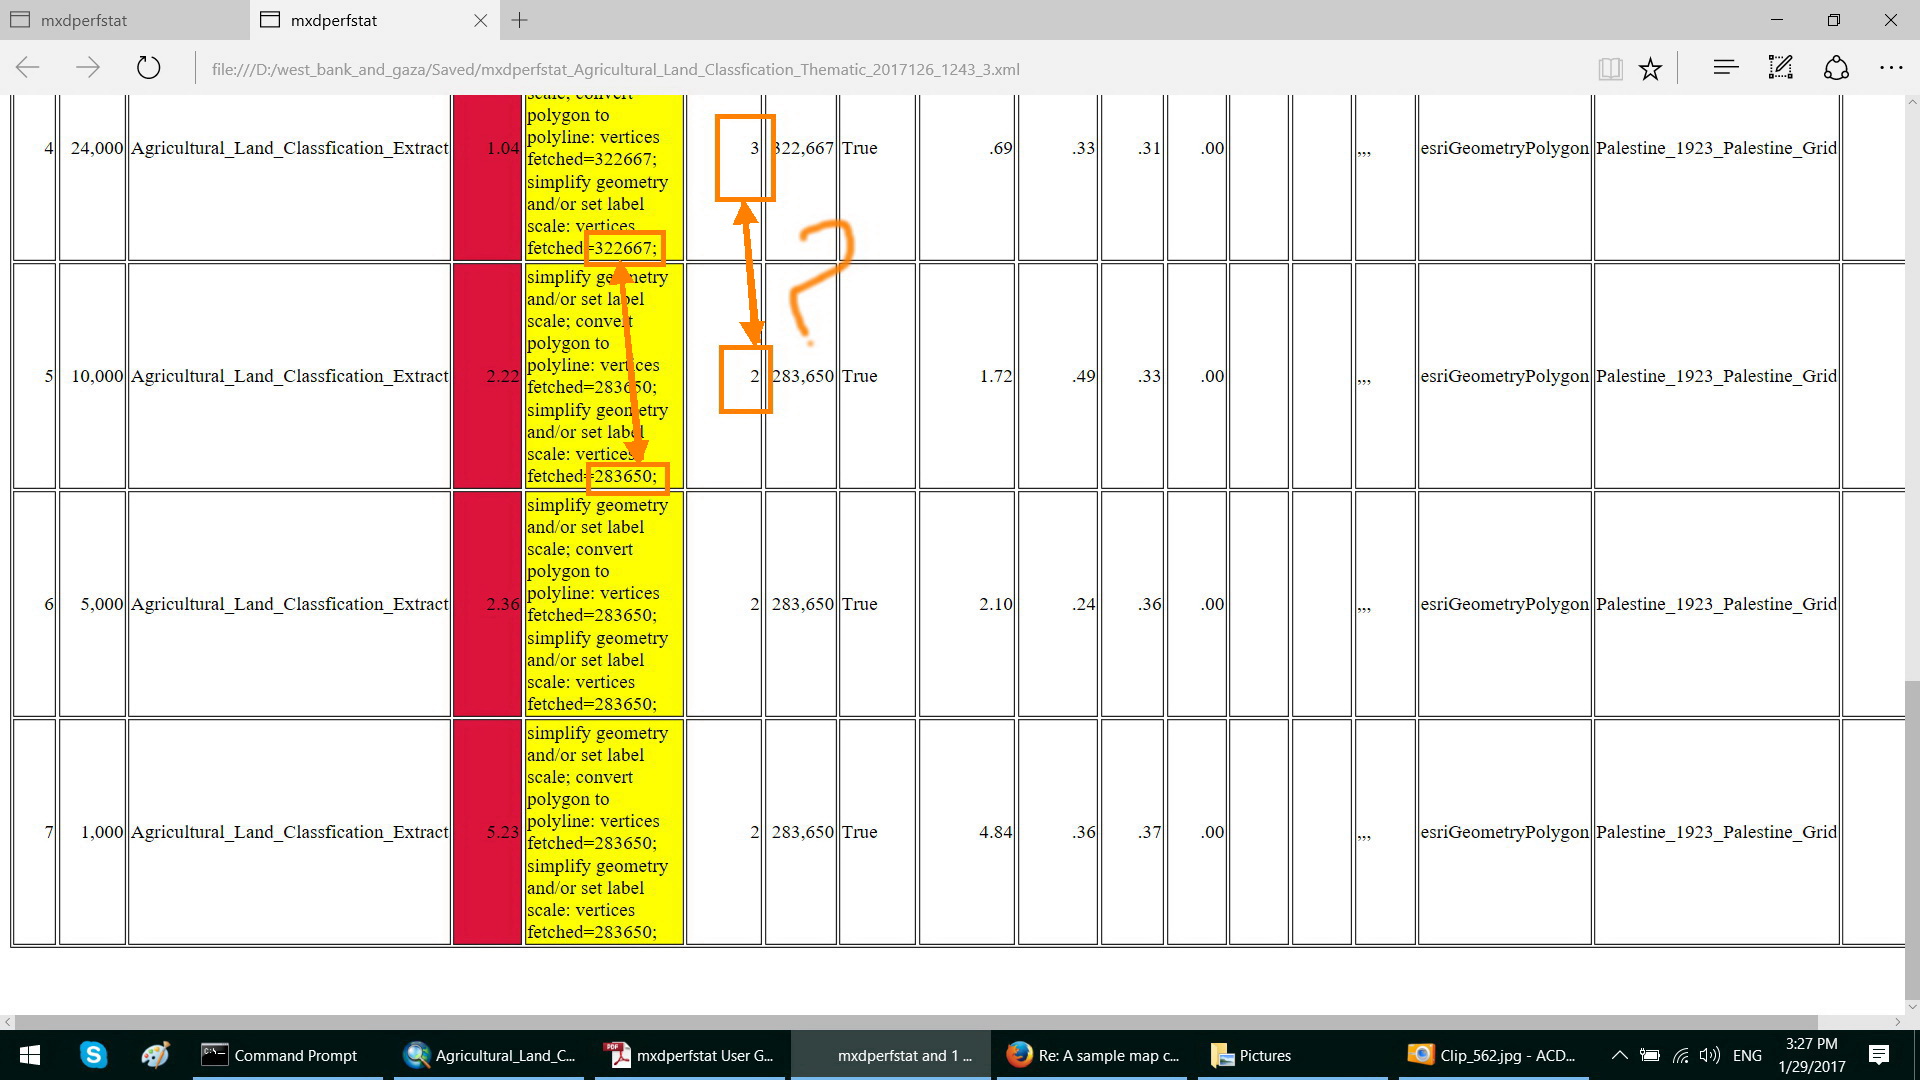
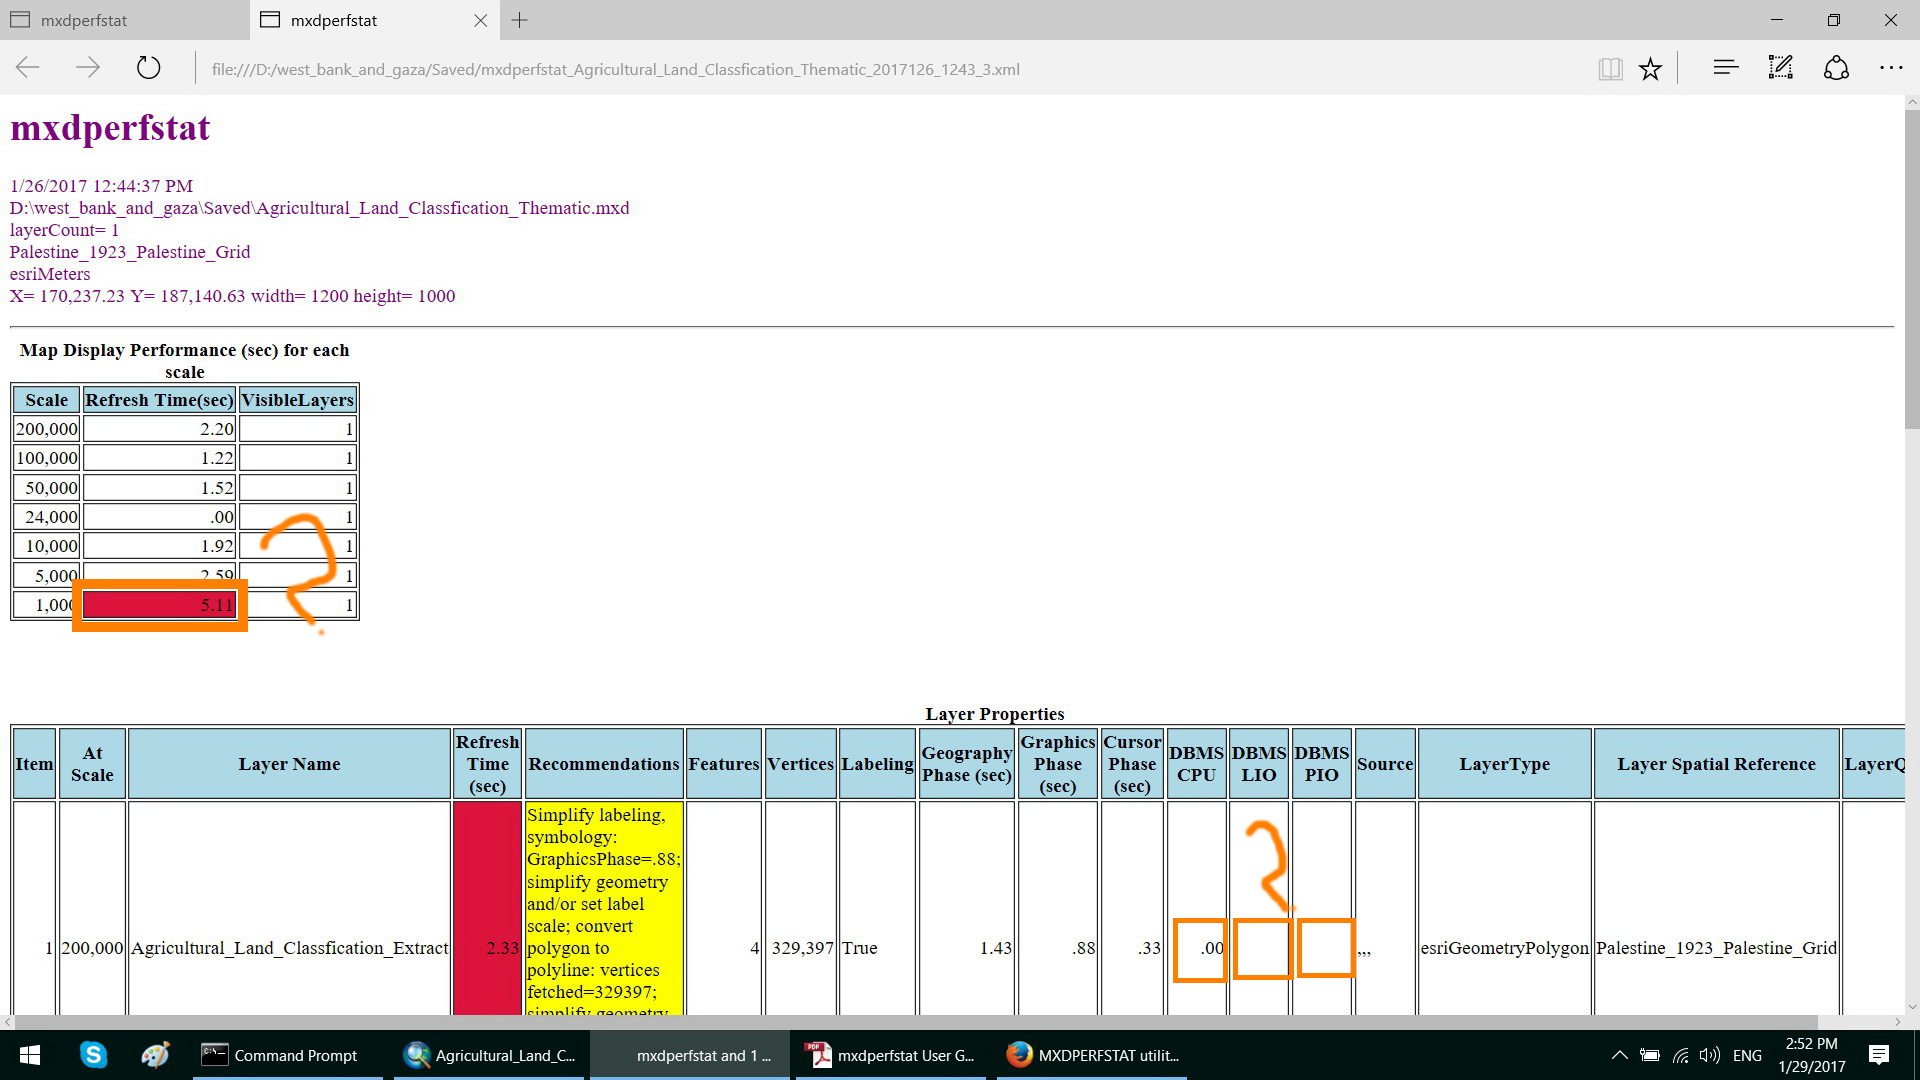
I attached files that shows the result of xmdperfstat report, I was wondering if anyone could clarify me or feed me back about the followings:
1.The meaning of red Label on refresh time.
2.The meaning of red color on refresh time column.
2.The meaning of red color on refresh time column.
3.The meaning of yellow color on recommendations column.
4. Number of features on largest scales is greater than smallest scales, and the same is for vertices fetches on recommendation column.
5. The disparity in report between cursor phase time.
6. No appearance for PIO and LIO indicators.
7. The zeros at CPU.
8.No appearance for time on graphic phase at recommendation column and it exists on graphic phase column.
7. The zeros at CPU.
8.No appearance for time on graphic phase at recommendation column and it exists on graphic phase column.
Best,
Fatin
2 Replies
04-03-2019
04:25 PM
- Mark as New
- Bookmark
- Subscribe
- Mute
- Subscribe to RSS Feed
- Permalink
Hi,
Have you resolved this issue. As I am having the same problem in understanding the report.
-DD
04-21-2019
02:07 AM
- Mark as New
- Bookmark
- Subscribe
- Mute
- Subscribe to RSS Feed
- Permalink
Hi Divya,
I'm still struggling with these issues. I hope someone can help us on this
Best,
Fatin