- Home
- :
- All Communities
- :
- Products
- :
- Data Management
- :
- Data Management Questions
- :
- Re: show categorical data from excel file with dif...
- Subscribe to RSS Feed
- Mark Topic as New
- Mark Topic as Read
- Float this Topic for Current User
- Bookmark
- Subscribe
- Mute
- Printer Friendly Page
show categorical data from excel file with different colours in GIS map
- Mark as New
- Bookmark
- Subscribe
- Mute
- Subscribe to RSS Feed
- Permalink
Hi all, I am trying to show categorical data with XY coordinates from an excel file (I have the ID column, 2-3 columns with the categorical data and the XY columns) in a GIS map. I have added my spreadsheet in gis, I right-clicked Display XY data, I could see all the points with one colour. But when I went to symbology-categories-specify the field with the categorical data-add all values, I changed the colour and size for each category (however there was a question mark in the count column) and Apply nothing happened. It was still one colour. I tried to open the attribute table but it was blank.
Could you please help me?
Thank you in advance.
Maria
- Mark as New
- Bookmark
- Subscribe
- Mute
- Subscribe to RSS Feed
- Permalink
can you post a small portion of your table ... perhaps there is an issue with your data types
also, you have posted your question in GeoNet help... which is about help on using GeoNet. I might suggest that you move your post to Managing Data Managing Data
The community structure is here GeoNet Community Structure
- Mark as New
- Bookmark
- Subscribe
- Mute
- Subscribe to RSS Feed
- Permalink
| ID | super | X | Y |
| 1 | E | 393035 | 454082 |
| 2 | E | 399522 | 446764 |
| 3 | G | 453296 | 425579 |
| 4 | B | 404212 | 490915 |
| 5 | B | 398227 | 504509 |
| 6 | C | 404153 | 499167 |
| 7 | B | 414776 | 466439 |
| 8 | C | 392218 | 487759 |
| 9 | C | 435909 | 375484 |
| 10 | F | 424556 | 422795 |
| 11 | C | 465178 | 507362 |
| 12 | F | 430654 | 490229 |
| 13 | F | 427010 | 413243 |
| 14 | G | 443150 | 473852 |
| 15 | C | 493368 | 491519 |
| 16 | C | 409917 | 421431 |
| 17 | C | 439272 | 391335 |
| 18 | F | 472519 | 447416 |
| 19 | C | 415129 | 437601 |
| 20 | C | 442346 | 488628 |
| 21 | C | 423986 | 497876 |
| 22 | E | 395871 | 451334 |
| 23 | C | 422522 | 479895 |
| 24 | B | 399553 | 426857 |
| 25 | B | 391737 | 425618 |
| 26 | C | 431401 | 408978 |
| 27 | C | 441620 | 490031 |
| 28 | E | 441067 | 476024 |
| 29 | C | 414431 | 487014 |
| 30 | G | 476505 | 467698 |
| 31 | D | 494230 | 490996 |
| 32 | G | 470473 | 448572 |
| 33 | G | 489244 | 479662 |
| 34 | G | 470521 | 430082 |
| 35 | E | 470657 | 481383 |
Here is a sample of my data; I have as well formatted the 'super' column which has my categorical data as text.
Thank you.
- Mark as New
- Bookmark
- Subscribe
- Mute
- Subscribe to RSS Feed
- Permalink
If you used Unique Values for your super column as shown here
Drawing a layer using categories—Help | ArcGIS for Desktop
then there shouldn't be an issue, assuming you added all the categories to the legend . then keep pressing Ok, apply, Ok to see the results...don't work about the count field just yet.
I would also recommend fine-tuning the colours AFTER you have the correct symbology applied first...not during the process...no point in wasting time if the base classification isn't going to work in the first place.
- Mark as New
- Bookmark
- Subscribe
- Mute
- Subscribe to RSS Feed
- Permalink
actually I have been trying this before and now but still doesn't work. I am still getting one colour of the <all other value>
- Mark as New
- Bookmark
- Subscribe
- Mute
- Subscribe to RSS Feed
- Permalink
<all other values>.... is the values that aren't in the classification scheme. If you have done it correctly, you should have a colour beside your super letters... A, B...E since that is the classified data. Check the link I sent and/or look onscreen. PS nothing is going to change until you OK your way out to the end and make the symbology apply to the map
- Mark as New
- Bookmark
- Subscribe
- Mute
- Subscribe to RSS Feed
- Permalink
but I have for each super letter a different colour being shown in the layers column on the left hand side of the GIS map; that is why I cannot understand why it is not working.
- Mark as New
- Bookmark
- Subscribe
- Mute
- Subscribe to RSS Feed
- Permalink
Ok... you are losing me..I can't see what you aren't seeing so if you have done the symbology correct you should have a legend in the table of contents representing the various classes...if you don't it is scrreen grab time to show what is going on
- Mark as New
- Bookmark
- Subscribe
- Mute
- Subscribe to RSS Feed
- Permalink
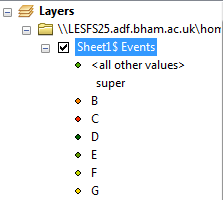
I made a screenshot of the table of contents for you to see that I am actually doing the symbology. But still don't get the colours in the map.
- Mark as New
- Bookmark
- Subscribe
- Mute
- Subscribe to RSS Feed
- Permalink
so they are points and you appear to be in data view, now when you go back to the dataframe, right-click on that layer and select zoom to layer... the dots should appear If they don't, insert a new dataframe and add just that file. It would also be best to convert that event layer to a featureclass or shapefile and ensure it has a defined projection... this should be done way before symbology is handled