- Home
- :
- All Communities
- :
- Products
- :
- Data Management
- :
- Data Management Questions
- :
- Re: Project for a class
- Subscribe to RSS Feed
- Mark Topic as New
- Mark Topic as Read
- Float this Topic for Current User
- Bookmark
- Subscribe
- Mute
- Printer Friendly Page
Project for a class
- Mark as New
- Bookmark
- Subscribe
- Mute
- Subscribe to RSS Feed
- Permalink
Hi, I am in a class that uses ARC GIS 10.2.2. Until now, my professor has always given us the data that we needed for projects. However, I have my own data in an Excel and I want to put it in ARC GIS. I have no idea how to create an attribute table, or if it would be easier to include the Microsoft Excel document.
Can someone tell me how to do either or both of those?
Thanks,
Chase
- Mark as New
- Bookmark
- Subscribe
- Mute
- Subscribe to RSS Feed
- Permalink
| STATE_CODE | ALUMNI_NUMBER |
| AK | 198 |
| AL | 903 |
| AR | 290 |
| AZ | 821 |
| CA | 2578 |
| CO | 862 |
| CT | 326 |
| DC | 200 |
| DE | 167 |
| FL | 5557 |
| GA | 2686 |
| HI | 139 |
| IA | 196 |
| ID | 155 |
| IL | 1892 |
| IN | 9033 |
| KS | 343 |
| KY | 94213 |
| LA | 359 |
| MA | 546 |
| MD | 1024 |
| ME | 115 |
| MI | 900 |
| MN | 474 |
| MO | 1006 |
| MS | 329 |
| MT | 106 |
| NC | 2401 |
| ND | 33 |
| NE | 103 |
| NH | 125 |
| NJ | 642 |
| NM | 239 |
| NV | 299 |
| NY | 1134 |
| OH | 3422 |
| OK | 262 |
| OR | 391 |
| PA | 1034 |
| RI | 91 |
| SC | 1202 |
| SD | 33 |
| TN | 2522 |
| TX | 2832 |
| UT | 308 |
| VA | 2060 |
| VT | 59 |
| WA | 712 |
| WI | 547 |
| WV | 265 |
| WY | 58 |
- Mark as New
- Bookmark
- Subscribe
- Mute
- Subscribe to RSS Feed
- Permalink
Chase,
Try this:
1) Save in notepad, e.g. myfile.txt:
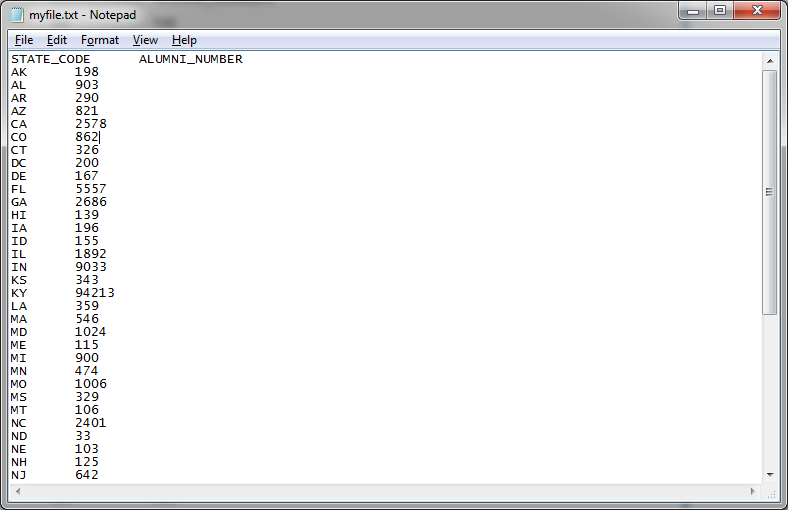
2) Open Excel
3) Open file
4) Choose "all files (*.*)" in drop-down
5) Navigate to directory containing your .txt
6) Choose "Delimited" in the import wizard
7) Check "My data has header"
😎 Start import at row 1
9) Next
10) Choose "Tab" as delimiter
11) You can leave the text qualifier as "
12) Next
13) Click on the STATE_CODE column
14) Choose "Text" as format
15) Click on the ALUMNI_NUMBER column
16) Looks like you can leave as "General" for the format type
17) Finish
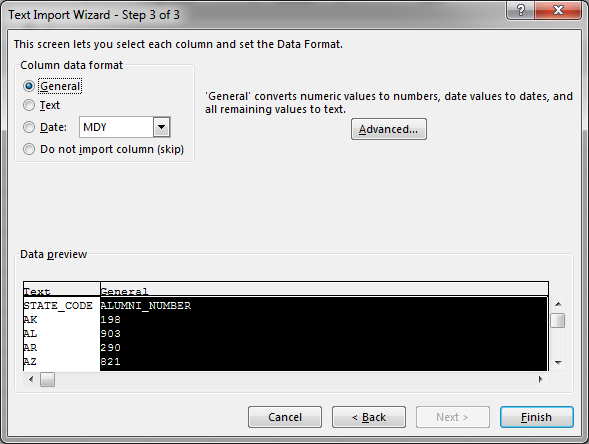
18) Verify Excel output
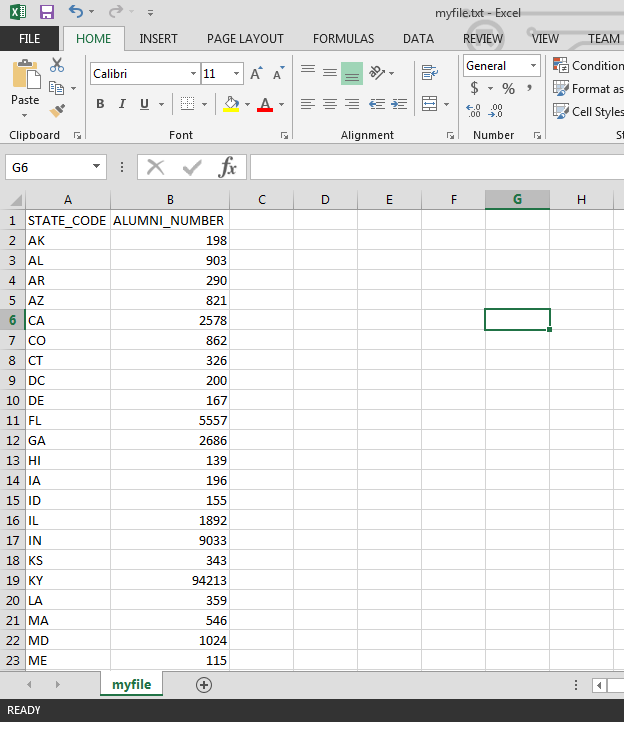
19) Save as .xlsx if you have Excel 2007+ installed on your GIS box, otherwise, save as .xls

20) Open ArcMap
21) Add data
22) Double click on your .xls
23) Select the worksheet
24) Add
25) Right click and confirm the attribute table
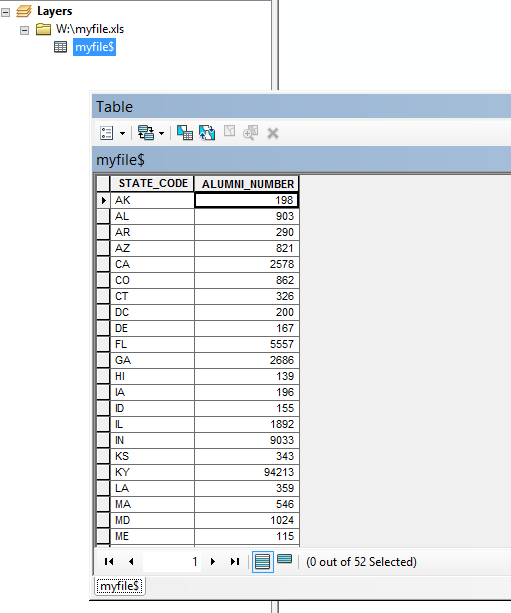
26) Download state shapefile - ftp://ftp2.census.gov/geo/tiger/TIGER2015/STATE/tl_2015_us_state.zip
27) Unzip
28) Add data in ArcMap
29) Navigate to the State shapefile - "tl_2015_us_state.shp"
30) Verify rendering in ArcMap
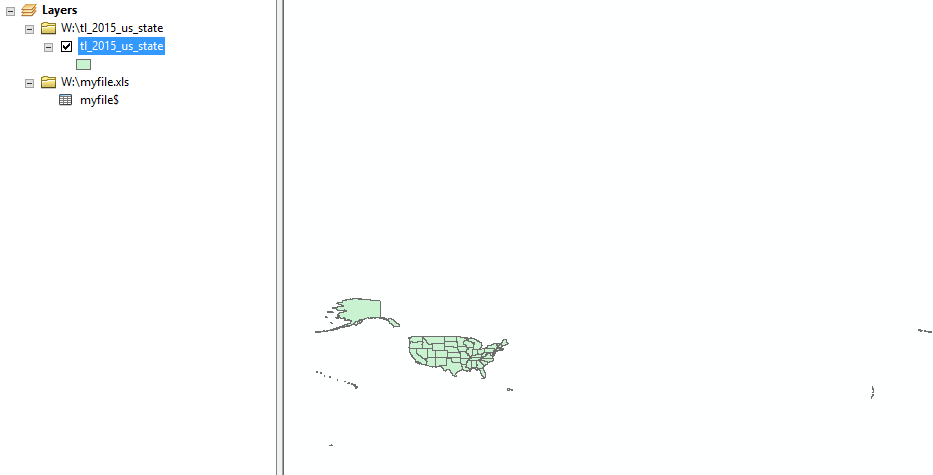
31) Right-click "tl_2015_us_state"
32) Joins and Relates
33) Join
34) Join attributes from a table
35) 1 - STUSPS
36) 2 - myfile$
37) STATE_CODE
38) Keep all records
39) Validate join

40) Close
41) OK
42) Right-click "tl_2015_us_state"
43) Open attribute table
44) Scroll over to the last two columns
45) Confirm Join
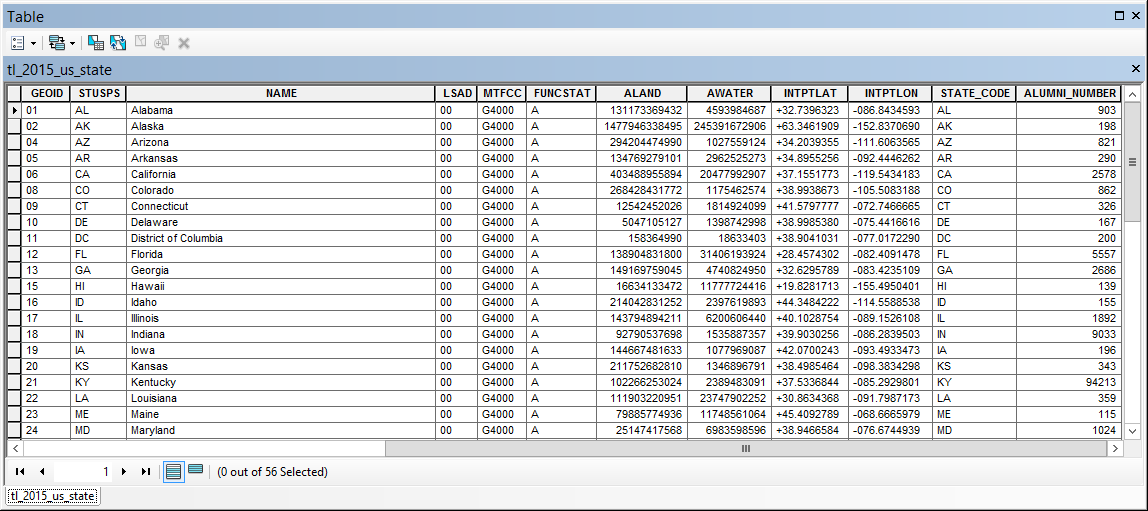
46) Close table
47) Right-click "tl_2015_us_state"
48) Properties
49) Symbology tab
50) Quantities
51) Graduated colors
52) Value - ALUMNI_NUMBER

53) OK
54) Review choropleth
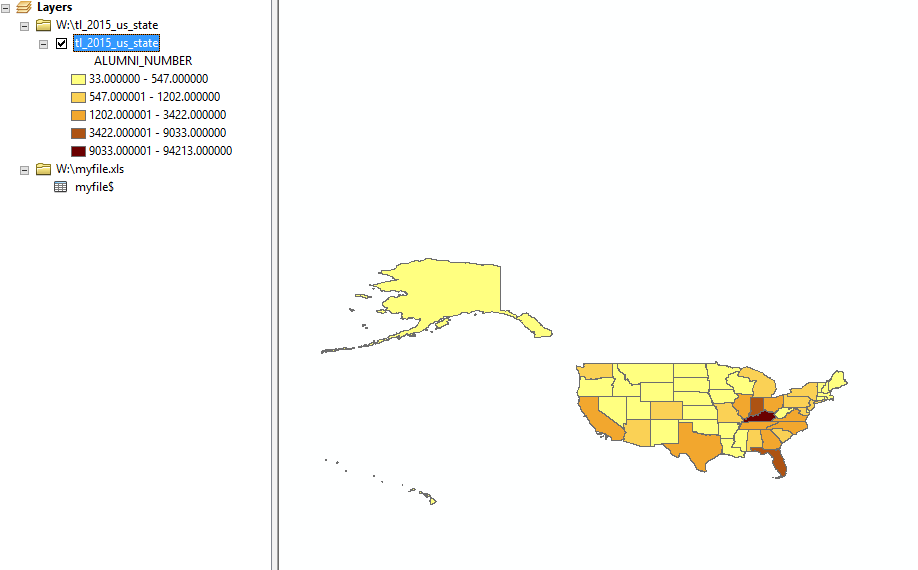
- Mark as New
- Bookmark
- Subscribe
- Mute
- Subscribe to RSS Feed
- Permalink
Also, here's some info on working with layout view:
Displaying maps in data view and layout view—Help | ArcGIS for Desktop
And printing the map:
About map printing—Help | ArcGIS for Desktop
Here's information on symbolizing based on quantity:
About symbolizing layers to represent quantity—Help | ArcGIS for Desktop
I would also recommend adding a map legend, scalebar, north arrow, etc.
- Mark as New
- Bookmark
- Subscribe
- Mute
- Subscribe to RSS Feed
- Permalink
Merrrr, I hope I just didn't do a whole homework assignment for you... You'd better make this a good research paper! Make sure you understand exactly what just happened... I think the biggest stumbling block is just getting the data into ArcMap - the rest of this stuff you probably already knew.
- Mark as New
- Bookmark
- Subscribe
- Mute
- Subscribe to RSS Feed
- Permalink
I've seen this happen with CSV files. Open it in Excel and save it as a workbook. Add the sheet from the workbook to ArcMap. It should display properly in the attribute table.
Are you using a Mac?
-Steven.
- Mark as New
- Bookmark
- Subscribe
- Mute
- Subscribe to RSS Feed
- Permalink
Here's your basic workflow.
Download states layer here:
ftp://ftp2.census.gov/geo/tiger/TIGER2015/STATE/
Bring it into ArcMap
Bring in your excel document with the Alumni numbers and State fields.
Join the excel document to the states layer based on state name. These fields must match exactly.
You will have your information geographically displayed on the map with your alumni numbers associated with them.
You can now symbolize the states based on the number of alumni per state.
-Steven
- « Previous
-
- 1
- 2
- Next »
- « Previous
-
- 1
- 2
- Next »