- Home
- :
- All Communities
- :
- Products
- :
- Data Management
- :
- Data Management Questions
- :
- open netcdf file with different years
- Subscribe to RSS Feed
- Mark Topic as New
- Mark Topic as Read
- Float this Topic for Current User
- Bookmark
- Subscribe
- Mute
- Printer Friendly Page
open netcdf file with different years
- Mark as New
- Bookmark
- Subscribe
- Mute
- Subscribe to RSS Feed
- Permalink
I downloaded monthly gridded data from this website: http://browse.ceda.ac.uk/browse/badc/cru/data
(Registration is free, but required. Once registered, go to the tab “dataset” and search for “CRU”. You will find a number of datasets. Click on “CRU TS3.23: Climatic Research Unit (CRU) Time-Series (TS) Version 3.23 of High Resolution Gridded Data of Month-by-month Variation in Climate (Jan. 1901- Dec. 2014)”, click “Data”, then chose a variable (for instance “pet”). Chose the year-period (I took 2001-2010).
The file that you have now should contain monthly grids from January 2001 till December 2010. It is a netcdf file but I do not manage to see the different years. Once I open in it Arc Gis, I don’t find a way to select the different year/month-layers. I used "multidimensional tools" in the toolbox to open the map. I found on the internet somebody else who had the same problem, but I don't understand how he solved it. I am relatively new to ArcGis. (NetCDF to Raster (arcgis) - GIS - CartoTalk )
- Mark as New
- Bookmark
- Subscribe
- Mute
- Subscribe to RSS Feed
- Permalink
And probably relevant to mention: I have followed the instructions here: How to Define and Visualize Time Dimension in ArcGIS | GES DISC
But the time slider does not work for me.
- Mark as New
- Bookmark
- Subscribe
- Mute
- Subscribe to RSS Feed
- Permalink
Yes, but did you go through these links
What is netCDF data?—Help | ArcGIS for Desktop
About the netCDF Tutorial—Help | ArcGIS for Desktop
Reading netCDF data using geoprocessing tools—Help | ArcGIS for Desktop
plus more using netcdf as a search term
- Mark as New
- Bookmark
- Subscribe
- Mute
- Subscribe to RSS Feed
- Permalink
you might want to move this to Managing Data to see if there are any other ideas
- Mark as New
- Bookmark
- Subscribe
- Mute
- Subscribe to RSS Feed
- Permalink
Hi Dan,
Thank you very much for your suggestions. I have been looking at the website (I didn't know all of them), but they do not answer the questions that I have.
I have moved the question as you suggested! Thanks!
- Mark as New
- Bookmark
- Subscribe
- Mute
- Subscribe to RSS Feed
- Permalink
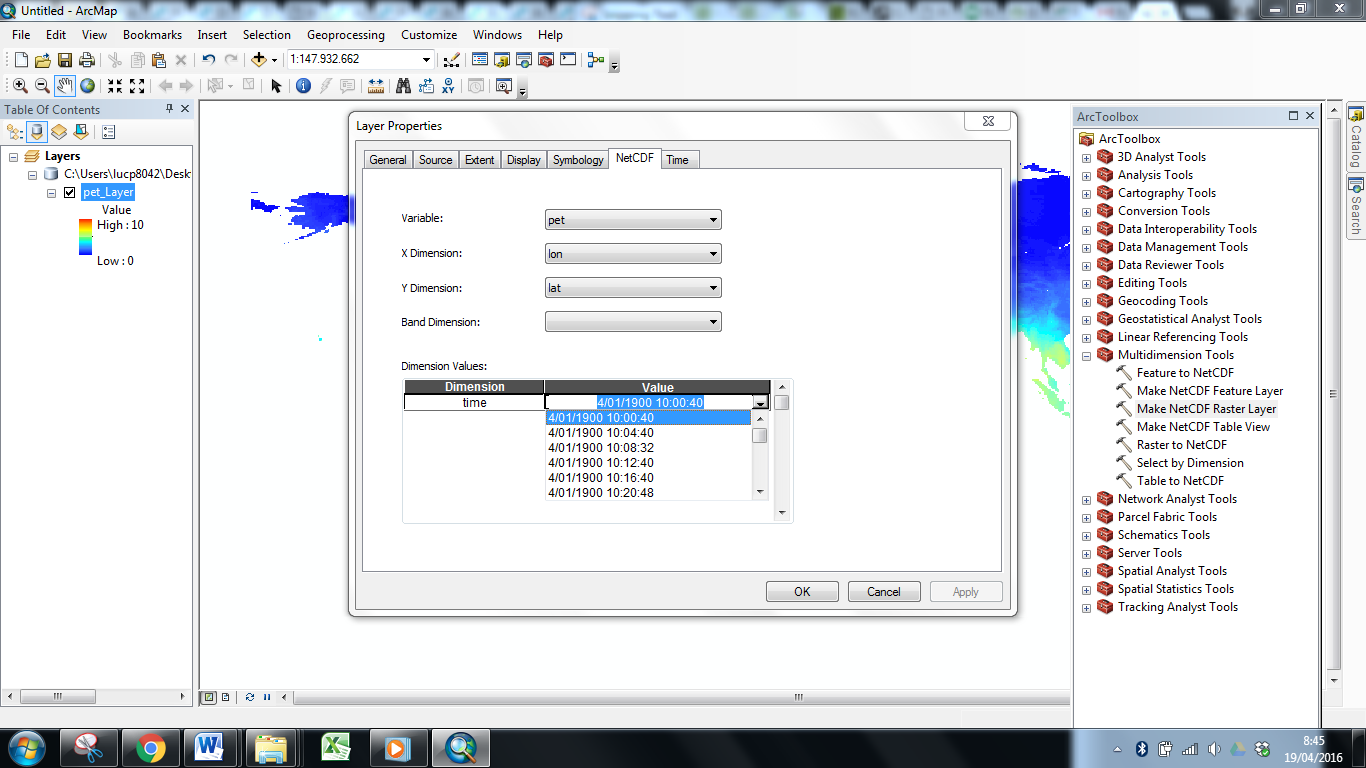
Once added to your map, double click on the layer and click on the NetCDF tab. Under this tab you can click on Value and change the time you want to look at.

- Mark as New
- Bookmark
- Subscribe
- Mute
- Subscribe to RSS Feed
- Permalink
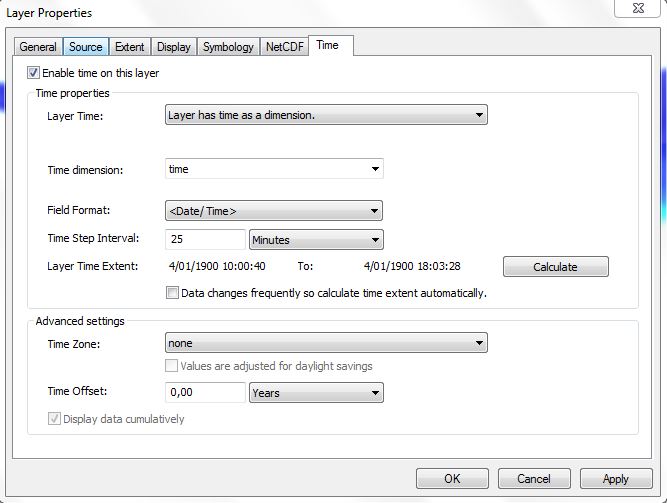
You can also go to the Time tab and time enable the layer to make it easy to step through the different time intervals.

- Mark as New
- Bookmark
- Subscribe
- Mute
- Subscribe to RSS Feed
- Permalink
Hi Andrew,
Thank you very much for your reply and sorry for my belated answer!
I do not manage to do what you suggest because I have a problem with reading the time dimension. The file I upload ranges from january 2000 to december 2010.
However, it shows me only some time values in 1900 (which is not correct since only monthly values are available).
I should be able to adapt this under the 'Time-tab' but each time I change the 'Time Step Interval' to 'Months', it changes it back to 'Minutes'.
- Mark as New
- Bookmark
- Subscribe
- Mute
- Subscribe to RSS Feed
- Permalink
there seems to be a regional setting differences between your examples and Andrew's
- Mark as New
- Bookmark
- Subscribe
- Mute
- Subscribe to RSS Feed
- Permalink
Which I can solve only if I know Andrew's settings? Or do you see from the example I gave immediately where the difference is?