- Home
- :
- All Communities
- :
- Products
- :
- Data Management
- :
- Data Management Questions
- :
- How to field calculate the mean of a field array?
- Subscribe to RSS Feed
- Mark Topic as New
- Mark Topic as Read
- Float this Topic for Current User
- Bookmark
- Subscribe
- Mute
- Printer Friendly Page
How to field calculate the mean of a field array?
- Mark as New
- Bookmark
- Subscribe
- Mute
- Subscribe to RSS Feed
- Permalink
Hello,
I'm stumped by a problem that I think should have a fairly straightforward answer...
I have a few hundred features with a number of attributes, all numerical. Some features have all attributes filled in, but some have a handful of null values. Is there any way of calculating the mean value for each feature that takes into account these null values? For instance, it calculates how many attributes are not null for each feature and uses that to generate the mean?
Would really appreciate any help on this!
Thanks 
- Mark as New
- Bookmark
- Subscribe
- Mute
- Subscribe to RSS Feed
- Permalink
Remove the brackets, which compile a list (maybe) to pass the N parameters, or change the function to receive a list. Right now you're just violating Field Calculator linkage rules.
- Mark as New
- Bookmark
- Subscribe
- Mute
- Subscribe to RSS Feed
- Permalink
The mean of a sample population is the sum divided by the count. The "count" is of the non-NULL values. All you need is a mechanism to sum values, incrementing the count for each value summed.
sum = 0.0
count = 0
for elem in array:
if elem:
sum += elem
count += 1
if (count > 0):
print("Mean = {:.2f}".format(sum / float(count)))
else:
print("Mean undefined!")This would be easily adapted to a DA Cursor, since a row is an array.
- Mark as New
- Bookmark
- Subscribe
- Mute
- Subscribe to RSS Feed
- Permalink
Hi Vince, thanks for your suggestion. How would I enter this code? Is this something that can be used in the Field Calculator?
- Mark as New
- Bookmark
- Subscribe
- Mute
- Subscribe to RSS Feed
- Permalink
You'd need to increase the indent, and construct the list, but yes, this simple bit of code could be added anywhere. Your code above would work if you format it correctly for the Field Calculator, but it's wasteful -- Why assemble a new list just to compile a sum? (It's an order of magnitude more work, and of O(n^2) complexity).
Please be sure to include all critical details in the initial question (use of Field Calculator, for example), since changing the question in follow-ups will reduce the value of answers to those who search for the same question.
- V
- Mark as New
- Bookmark
- Subscribe
- Mute
- Subscribe to RSS Feed
- Permalink
I agree with Vince about providing the critical details. Not only does it get you better or higher quality answers, it saves community members time by not having them inadvertently answer a question you aren't asking.
The only caveat or footnote I would add to Vince's comment about constructing another list is that Python's built-in data constructors and functions are highly optimized. Whereas creating a new list and using append to populate it isn't very efficient, list comprehensions are quite efficient. In this case, using a list comprehension to construct a new filtered list allows for the use of more Python built-in functions, and the more built-in functions you can use, the better.
def mean(lst):
lst = [i for i in lst if i]
return sum(lst) / float(len(lst))You can call it using your original syntax, which created a list:
mean([ !Welcoming!, !Access!, !Community!, !Safe!, !Provision!, !Quality!, !Security!, !Dog!, !Litter!, !Grounds! ])For someone new to Python, I would say don't pay much attention to either Vince's or my comments about optimizing code. Optimizing code gets tricky because it involves balancing computer science theory with the reality of interpreter implementations, and often times premature attempts to optimize code confuse the new learner and set him/her back from learning the basic.
Fundamentally, your problem today was that you were incorrectly calling your function. The way you defined your function, it wanted 10 arguments instead of a single argument containing a list. Since you were passing the function a single list of 10 items, it was informing you that there were 9 missing arguments.
- Mark as New
- Bookmark
- Subscribe
- Mute
- Subscribe to RSS Feed
- Permalink
Joshua --
Perhaps it was the fact that I was using a VM, but I got different results on successive executions of a benchmark test, with some iterations showing each of the three mean methods as being fastest(!). I needed to iterate the algorithm invocations ten thousand times, using an array of length 10,000 in order to make more than a hundredth of a second difference, so I guess the most intuitive algorithm for the developer is the "best" in this context.
- V
- Mark as New
- Bookmark
- Subscribe
- Mute
- Subscribe to RSS Feed
- Permalink
I hear ya. I had to do over 100,000 runs with a 10 item list to get consistently different times between the runs with timeit, and even when I got consistent times they were all in the same ballpark or order of magnitude. I know Python gets knocked for "just being a scripting language" and not performing as quick as compiled languages, but often times I find the performance of Python to be more than adequate and scripting in Python is much more enjoyable.
I think your comment is spot on, especially for new scripters, i.e, use the most intuitive algorithm for the developer because that will likely be the easiest to read and maintain over time.
- Mark as New
- Bookmark
- Subscribe
- Mute
- Subscribe to RSS Feed
- Permalink
Python is a bytecode lanuage, much like Java (just more just-in-timey), and Java has gotten blazingly fast.
- V
- Mark as New
- Bookmark
- Subscribe
- Mute
- Subscribe to RSS Feed
- Permalink
Thank you so much Joshua, this very neat bit of code did the job perfectly!
- Mark as New
- Bookmark
- Subscribe
- Mute
- Subscribe to RSS Feed
- Permalink
On Code Sharing .... Statistics... Descriptive Statistics for Multiple Fields ....
Take this table which contains nulls, use Column Statistics

and get this result.
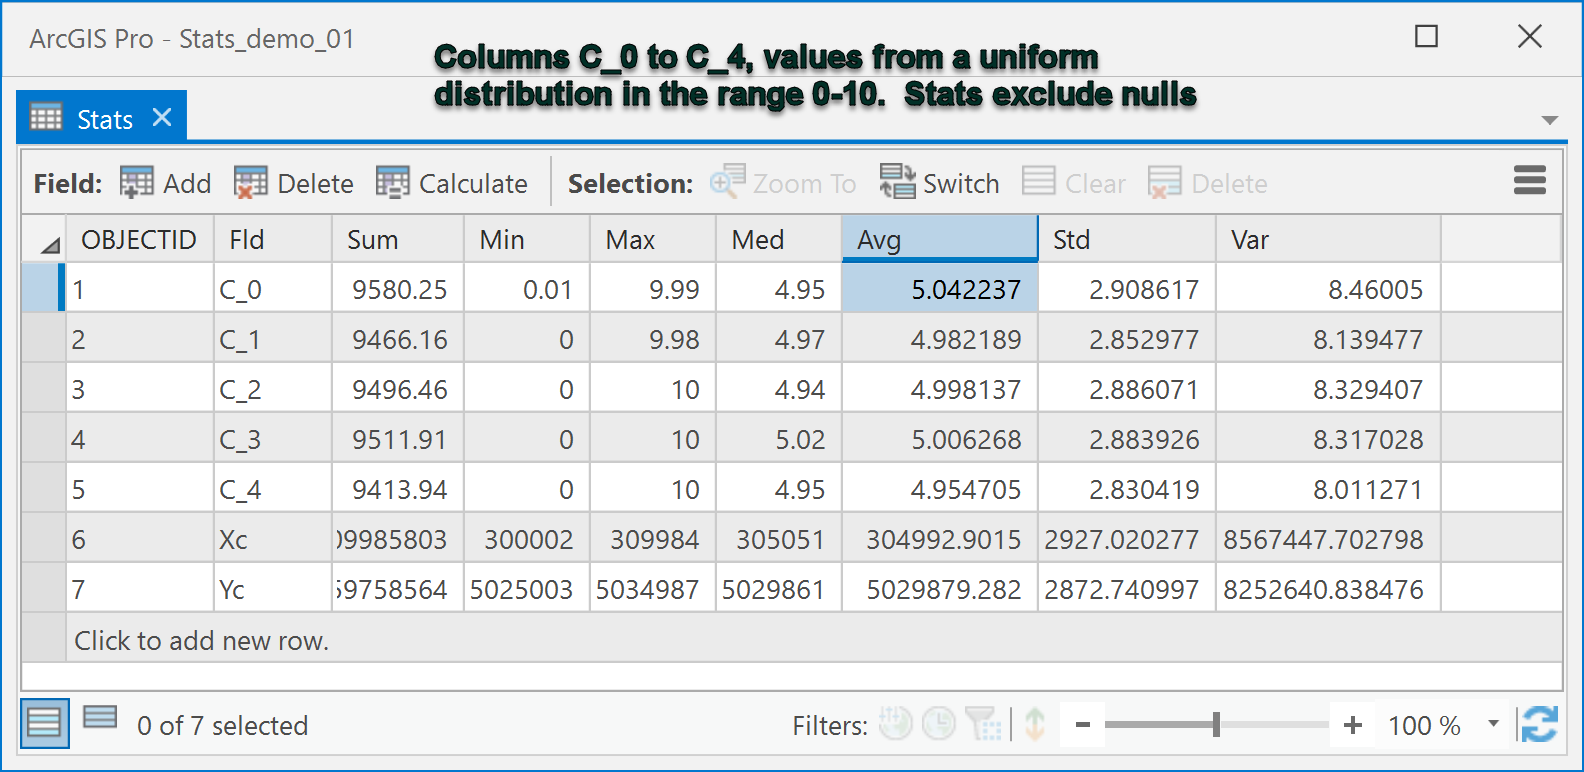
Of course the user must still determine the utility of any calculated values (eg sum of X coordinates).
All calculations done using numpy as described earlier since they can exclude nulls since TableToNumPyArray and FeatureToNumPyArray handle table nulls quite nicely. So instead of a search cursor going row by row, a calculation is performed on a column of data at once.
The basic principles I described earlier still apply if one wishes to use python/numpy code rather than go through the fluff of a dialog interface.
The code is accessible in the download.
I have no intention of batching this... batching would require that all fields in all tables be the same... if they are, then batch my code functions (defs) ore preferably, hire a student to do the work for you 
PS... anyone wanting to benchmark this against search cursors, I can send a geodatabase of desired size and content. Alternately, I have code that will create a geodatabase table of NxM rows and columns of double values, as a point featureclass. The data can be constructed of any desired statistical distribution that numpy supports and you can incorporate nulls within the fields. It is speedy for the speed needy