Turn on suggestions
Auto-suggest helps you quickly narrow down your search results by suggesting possible matches as you type.
Cancel
- Home
- :
- All Communities
- :
- User Groups
- :
- Cartography and Maps
- :
- Questions
- :
- Hi everybody? i want to know what kind of map is t...
Options
- Subscribe to RSS Feed
- Mark Topic as New
- Mark Topic as Read
- Float this Topic for Current User
- Bookmark
- Subscribe
- Mute
- Printer Friendly Page
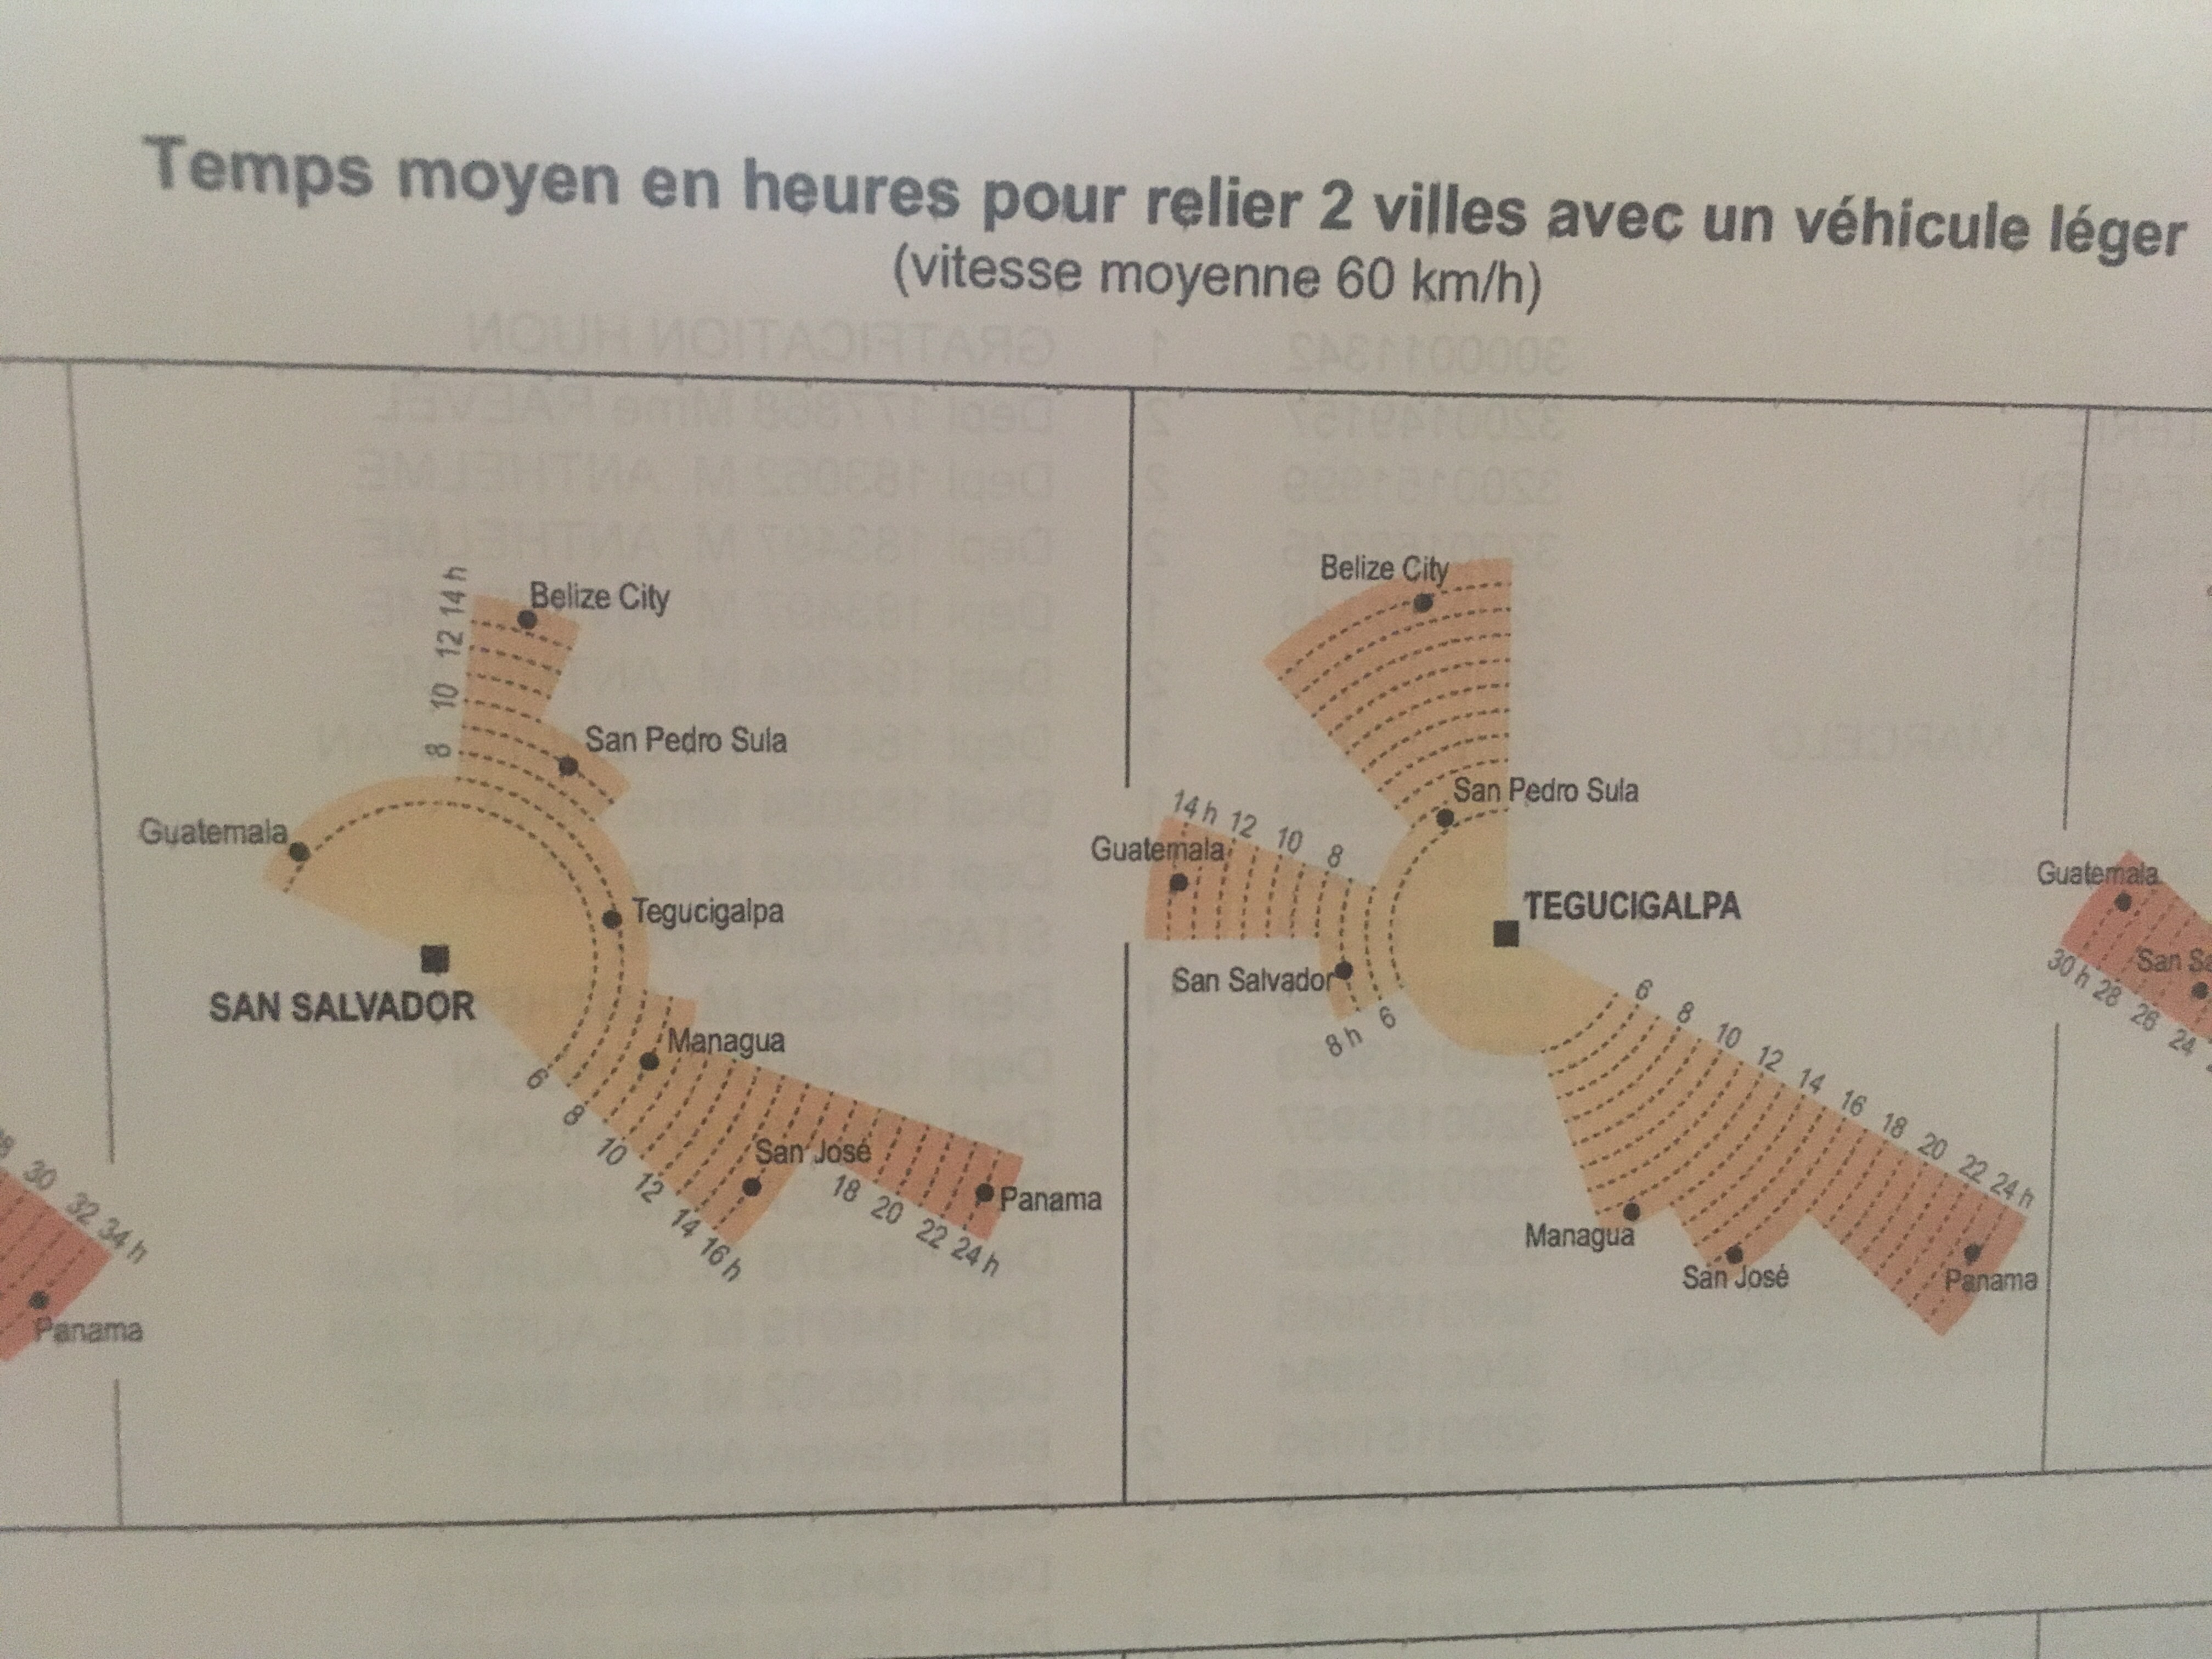
Hi everybody? i want to know what kind of map is these one? any idea ?? i have to make one ... but i don´t know? thank you all.
Subscribe
1023
2
03-12-2019 12:31 PM
2 Replies
03-12-2019
01:49 PM
- Mark as New
- Bookmark
- Subscribe
- Mute
- Subscribe to RSS Feed
- Permalink
Hi,
This type of graph is called a rose diagram. There is a report you can run in Business analyst called a "Wind Rose Report" but I'm not sure if this is what you are looking for.
How Wind Rose Report works—Help | ArcGIS Desktop
What kind of diagram/map are you trying to make?
03-12-2019
02:10 PM
- Mark as New
- Bookmark
- Subscribe
- Mute
- Subscribe to RSS Feed
- Permalink
Thank you for answer. Well, i have to make this rose diagram using the the average time it takes to a light vehicle to get from one city to another. The picture that i uploaded is the example.