- Home
- :
- All Communities
- :
- Developers
- :
- ArcObjects SDK
- :
- ArcObjects SDK Questions
- :
- Re: Displaying Measured data as straight line
- Subscribe to RSS Feed
- Mark Topic as New
- Mark Topic as Read
- Float this Topic for Current User
- Bookmark
- Subscribe
- Mute
- Printer Friendly Page
Displaying Measured data as straight line
- Mark as New
- Bookmark
- Subscribe
- Mute
- Subscribe to RSS Feed
- Permalink
- Report Inappropriate Content
Hi All,
I have several geodatabases that have geometries with Measures on them, i.e. a PolyLine with XYZ & M on each vertex. These can easy be displayed on a map by their XY coordinate.
However I'd like to be able to "straighten" these into a line to show route event data points at the measures, but I don't care about the XY location, sort of like a subway map.
Something like this:

Does anyone have any suggestions of where to start? I was thinking of maybe a custom layer or custom projection/transformation, to somehow display the M data as the X coordinate, with a fixed Y? (without creating new features classes)
Thanks
- Mark as New
- Bookmark
- Subscribe
- Mute
- Subscribe to RSS Feed
- Permalink
- Report Inappropriate Content
Hi Michael,
You can use IDataGraphT object to show your object as graph. It will work for one object only.
You need to create a table on hard disk with min 2 column for X and Y axis information. X axis could be distance between vertexes, Y axis - your measurements. Now you are ready to create template with ArcMap View->Graphs->Create Graph. When you have template, you are ready to use it as legend for your graph created from code. From your code you need to create the same structure table as described above. It could be created in scratch workspace. Fill table with information about your polyline object.
- Mark as New
- Bookmark
- Subscribe
- Mute
- Subscribe to RSS Feed
- Permalink
- Report Inappropriate Content
Thanks ... I am hoping to do this dynamically without having to reprocess the data, but I will look into this method; or see if there's some web methods.
- Mark as New
- Bookmark
- Subscribe
- Mute
- Subscribe to RSS Feed
- Permalink
- Report Inappropriate Content
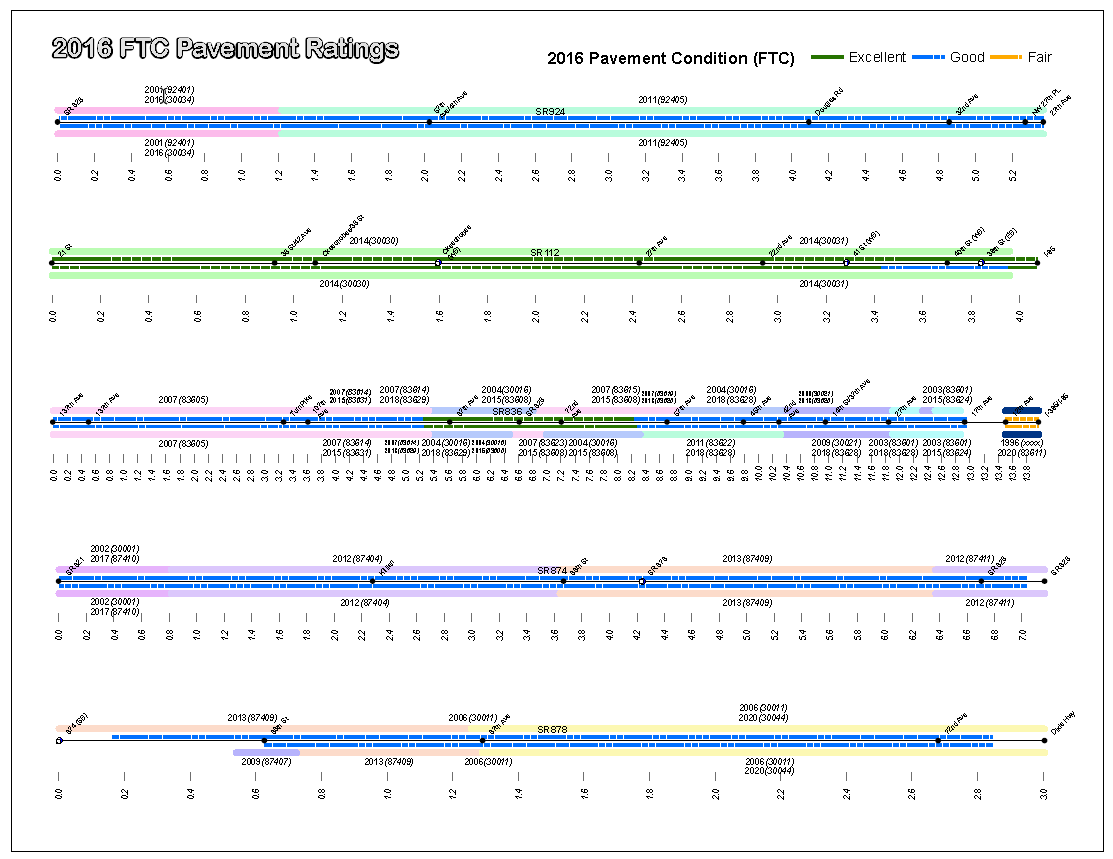
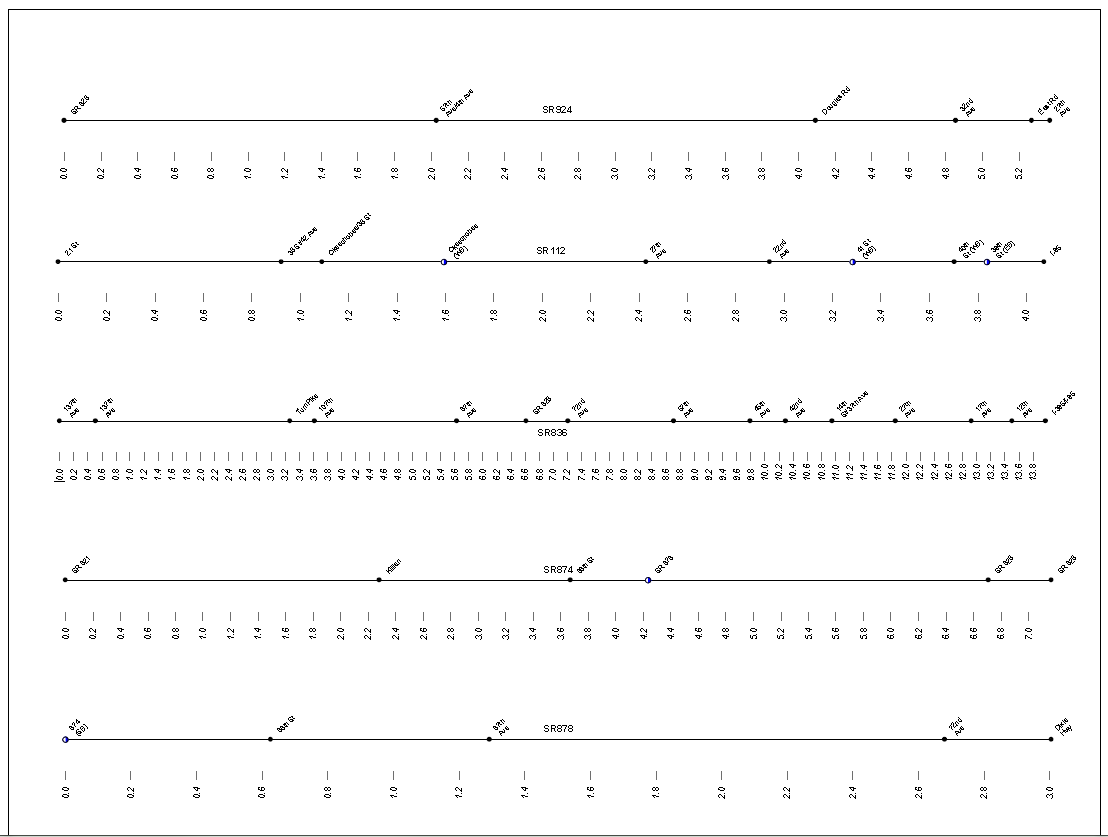
I do a down dirty Straight Line Diagram by using Linear Referencing systems:
For my use, I map out/drawn 5 Expressways as equal length lines. For each line I created a "Route" with the starting Mile point value and ending Milepoint value. From there I simply event map the attributes against the created routes... in my example I event mapped intersections with no offset against the linear referenced roads.
Same Linear Routes showing Pavement condition and Resurfacing Projects......