- Home
- :
- All Communities
- :
- Products
- :
- ArcGIS Web AppBuilder
- :
- ArcGIS Web AppBuilder Questions
- :
- Multiple Line Series in Line Chart Widget
- Subscribe to RSS Feed
- Mark Topic as New
- Mark Topic as Read
- Float this Topic for Current User
- Bookmark
- Subscribe
- Mute
- Printer Friendly Page
Multiple Line Series in Line Chart Widget
- Mark as New
- Bookmark
- Subscribe
- Mute
- Subscribe to RSS Feed
- Permalink
When viewing the templates for the infographic widget, the Line Chart shows two series (one orange, and one blue). However, after trying for about an hour, I was unable to produce more than one line series for a single chart. How can I plot multiple lines on the same chart?
I'm looking to chart depth values (y-axis) by date (x-axis) for each well (different series). The fields are simply: well name, date, depth in ft.
- Mark as New
- Bookmark
- Subscribe
- Mute
- Subscribe to RSS Feed
- Permalink
Hi, a late reply, but might be relevant for others as well.
So to be able to visualize multiple lines you need multiple numeric fields in your data. So you might need to restructure your data.
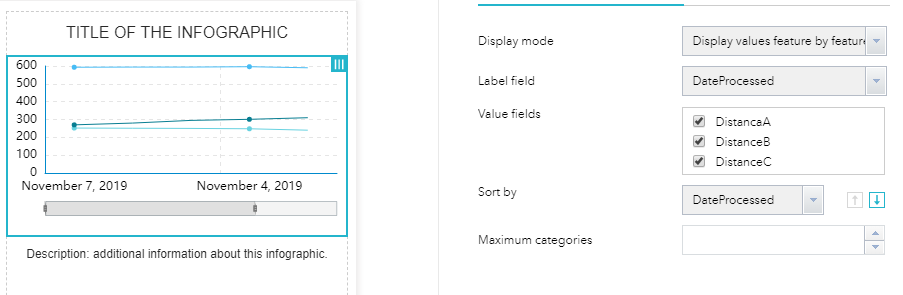
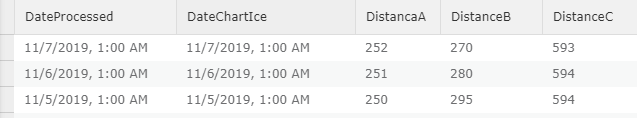
So by setting up your data similarly to what I've done here, then you're able to show the multiple lines.
- Mark as New
- Bookmark
- Subscribe
- Mute
- Subscribe to RSS Feed
- Permalink
Hi Einar Dørheim,
I did find that this could be done, unfortunately, most data is not setup this way. Forcing data into a restricted schema in order to use these widgets isn't really a viable solution.
Imagine if you have dozens of well sites, and you need to measure their depths each month, and you can only do a few each day. To keep data entry simple for the end user (which is incredibly important, I can't stress this enough), the data structure goes: Well Site, Date (auto), Well Depth. Your series are based on the well site, the Y axis is the depth, and the X axis is the date. If you want to use the multi-line feature, you would need to structure your data something like this: Month, Well 1 Depth, Well 2 Depth, Well 3 Depth... Well N Depth. And even here, you will loose the exact date that the depth was captured unless you also put a date field next to each one. This also forces users to edit the same record multiple times, which will likely result in a lot of user error.
You could use something like FME to automatically restructure the data in this format, but at that point, I might as well be making a custom app or exporting the data into a report that's emailed to the operations group.
- Mark as New
- Bookmark
- Subscribe
- Mute
- Subscribe to RSS Feed
- Permalink
yep, I know and agree. But for other use cases and users it is at least nice to know that this functionality is there. The widget should be improved to handle normal data sets, this functionality is available in operations dashboards, should not be to hard to get it into web appbuilder for ESRI.