Turn on suggestions
Auto-suggest helps you quickly narrow down your search results by suggesting possible matches as you type.
Cancel
- Home
- :
- All Communities
- :
- Products
- :
- ArcGIS Web AppBuilder
- :
- ArcGIS Web AppBuilder Questions
- :
- link charts to map
Options
- Subscribe to RSS Feed
- Mark Topic as New
- Mark Topic as Read
- Float this Topic for Current User
- Bookmark
- Subscribe
- Mute
- Printer Friendly Page
link charts to map
Subscribe
1803
1
01-10-2021 04:47 AM
01-10-2021
04:47 AM
- Mark as New
- Bookmark
- Subscribe
- Mute
- Subscribe to RSS Feed
- Permalink
Hey all--
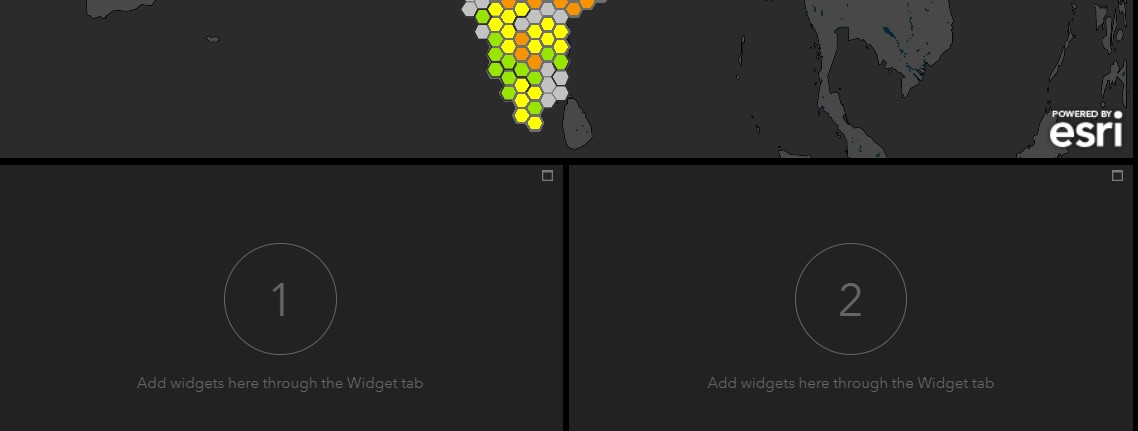
I was originally planning on using an Ops Dashboard, but just switched over to web app builder dashboard, as my map is time-series. My question is, how can I link the charts and infographics to the map so that when a user clicks on a state in the map, the charts update, like you can in ops dashboards? I would like the chart to be outside of the map window, as seen in the screenshot below. Seems like it should be really straightforward, but I can't figure it out.
Thanks!
Lydia
1 Reply
01-14-2021
03:12 AM
- Mark as New
- Bookmark
- Subscribe
- Mute
- Subscribe to RSS Feed
- Permalink
Hey @_____ I'm starting to get desperate about this one... Is it possible that this is not possible in web app builder? Any suggestions?
Thanks 😄