- Home
- :
- All Communities
- :
- Products
- :
- ArcGIS Web AppBuilder
- :
- ArcGIS Web AppBuilder Ideas
- :
- Web AppBuilder Reporting Widget
- Subscribe to RSS Feed
- Mark as New
- Mark as Read
- Bookmark
- Follow this Idea
- Printer Friendly Page
- Mark as New
- Bookmark
- Subscribe
- Mute
- Subscribe to RSS Feed
- Permalink
Would it be possible for ESRI to develop a customisable WAB Reporting Widget to generate reports that will contain a map and/or attribute information. Reporting functionality is a critical part of spatial workflows. It would be useful for any potential WAB report widget to be able to call upon nominated reports eg crystal reports, SQL reports, etc. Obviously the report and map would need a common identifier like the Objectid or land parcel identifier, etc.
If this is not possible how about a simple report builder widget that allows the administrator to bring together the nominated map, attributes, chart, etc from a resultant query.
ESRI you need to develop this widget as part of the standard widget interface in WAB. I realise one size doesn’t fit all when it comes to reporting but at least expose a simple reporting widget for clients to start to work with.
cheers
- « Previous
-
- 1
- 2
- 3
- Next »
Hi Rod Woodford,
The Solutions team recently released a configurable AWAB widget that supports reporting as part of the workflow. As of now, it requires an AWAB Developer Edition deployment. Moving into the summer this will become part of ArcGIS Online. As part of the work, we've created a report dijit that will be part of the next version of AWAB 2.4 developer edition.
Moving forward we will begin to incorporate reporting as additional solutions like our Situational Awareness solutions.
Feedback and comments are welcome.
Nikki
Esri Solution Lead
Hi Nikki,
Thats great news. Look forward to working with it.
cheers
Rod
Outstanding job on the widget! Look forward to seeing it in the next version of the AWAB.
One use case to consider for future development....
It would be nice if this widget allowed you to consume an output from the Analysis widget, either pulling the output layer in directly within the Report widget UI (preferred) or exporting a geojson of the analysis for import back into the widget. For instance, we use the Trace Downstream analysis to identify sensitive receptors (water intakes, wetlands, etc) downstream of an oil or hazardous material spill and it would be nice to be able to use the trace downstream analysis output to generate a report of sensitive receptors.
I believe the reporting that is described by Rod is of the ability to create custom PDFs with tables, images, maps etc. To be able to select specific parameters and have a customized templated PDF output for the user.
I also have had high client demand for reporting, as in, PDF export of tables / maps etc. which usually end up having to be complex custom, ground up .net items.
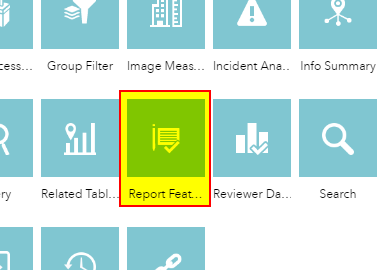
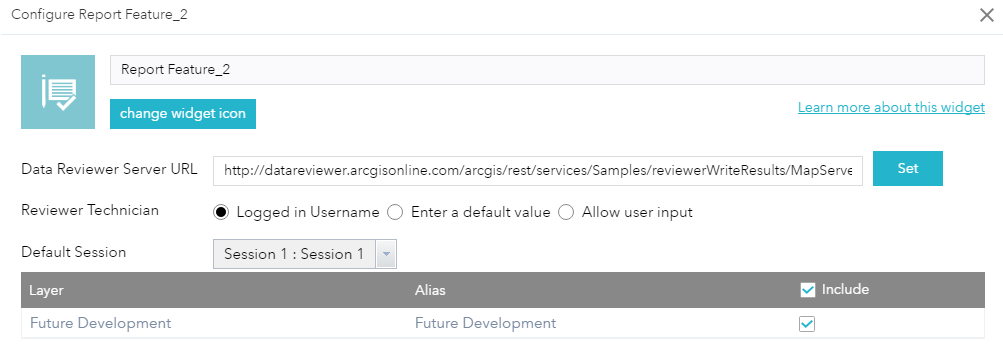
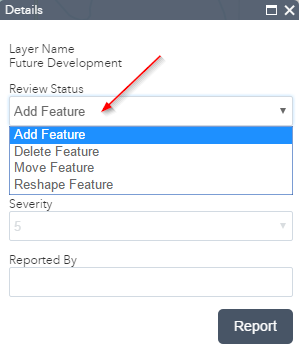
The reporting included in WABde 2.4 is a 'markup' - report an error in geometry 'reporting'. This workflow is for fixing data using the web interface. Click on a feature... review status, Notes, severity, reported by. This is a feedback widget to be used in conjunction with ArcGIS Data Reviewer for Server Extension. Quite different than what I think we are looking for. (e.g. ReportLab Plus - System PDF Generation)
what WABde looks like:
Configuring the Reporting Widget
Click on a feature... review status, Notes, severity, reported by.

Hi Michael,
I don't believe the widget was included in WAB Dev 2.4. You'll need to download it from here: Environmental Screening | ArcGIS for State Government and add the "Screening" folder to your C:\arcgis-web-appbuilder-2.4\WebAppBuilderForArcGIS\client\stemapp\widgets directory.
Should look like this....
The widget you are highlighting was not included in WABde 2.4, however the direction (link) to the JavaScript was extremely helpful.
Hi William,
Is this tool compatible with Web AppBuilder Dev edition 2.1 or below?
Hello,
I was going through this app: ArcGIS Web Application
If you open the Situational Awareness widget you can see there is a report button that allows the user to generate beautiful reports.
Do you guys know where we can get the code for this?
or at least the person who did this app.
Thank you.
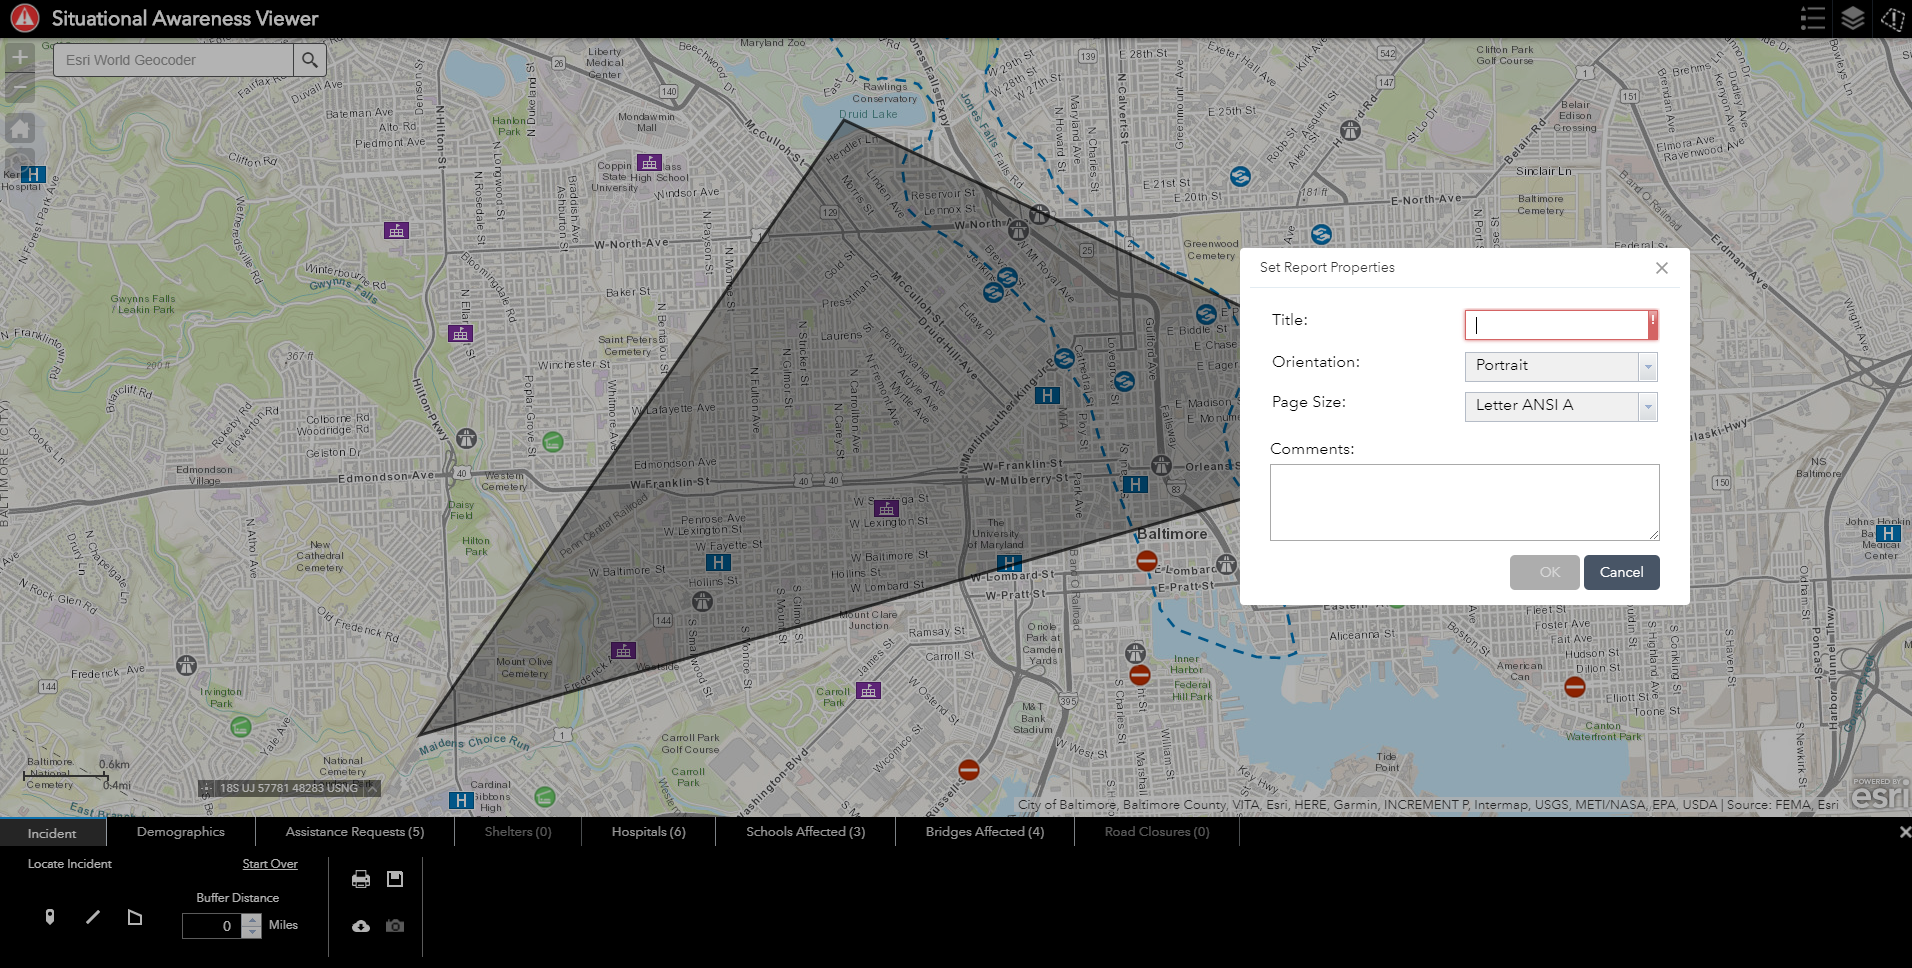
I think the 'Situational awareness' widget is now available as out-of-the-box tool in Web AppBuilder. Here is the screenshot from WAB 2.4 Developer Edition.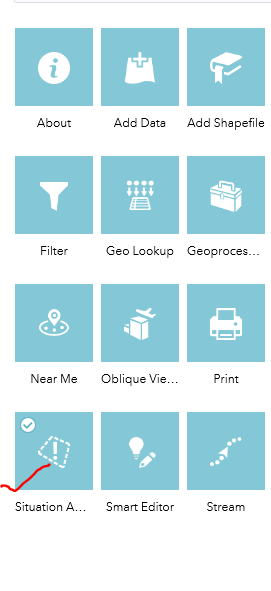
Those are nice tools, but not reports. Reports are like 8.5 x 11 PDF pages you can print out that shows charts, graphs, tables, maps, populated into a pre-configured template.
The dashboard template for WAB is terrific, especially with all of the new charts and infographic types. Now what it needs is not any more chart types, but rather a WAB widget enabling printed reports from a WAB Dashboard.
Somewhat confusing is that there is a WAB dashboard template, not to be confused with the new Operations Dashboard which looks extremely similar but seems not as customizable.
You must be a registered user to add a comment. If you've already registered, sign in. Otherwise, register and sign in.