- Home
- :
- All Communities
- :
- Products
- :
- ArcGIS Web AppBuilder
- :
- ArcGIS Web AppBuilder Ideas
- :
- arcade integration with infographic widget
- Subscribe to RSS Feed
- Mark as New
- Mark as Read
- Bookmark
- Follow this Idea
- Printer Friendly Page
- Mark as New
- Bookmark
- Subscribe
- Mute
- Subscribe to RSS Feed
- Permalink
It would be useful for the infographic widget to be able to read / visualize arcade expressions created in popups in the associated webmap'
see also: Allow WebAppBuilder and Ops Dashboard to Read Arcade Expressions
Yes, I agree!
My use case is a bit different.
I would like to add the query filters selected by the user into the description of the graph, when using the Infographic Widget on the query output result. This might eventually be done using Arcade.
I was in contact with Esri Technical Support and they logged the following enhancement request, so it would be cool if this idea gets some support from other users:
ENH-000107791: Web App Builder Infographic Widget should have option to generate graph descriptions based on queries.
infographic widget
arcade
query widget
I also agree, this is would be a very beneficial capability.
Can I get some follow up on this? The hyperlink in the idea description is not longer available. Does anyone have any info on this idea? It would be awesome!
Hi Mitch Holley,
I ran a quick test in WAB using a map that has multiple Arcade Expressions within it, and unfortunately it appears that this has not been implemented yet.
Arcade Field appearance in the web map pop up: 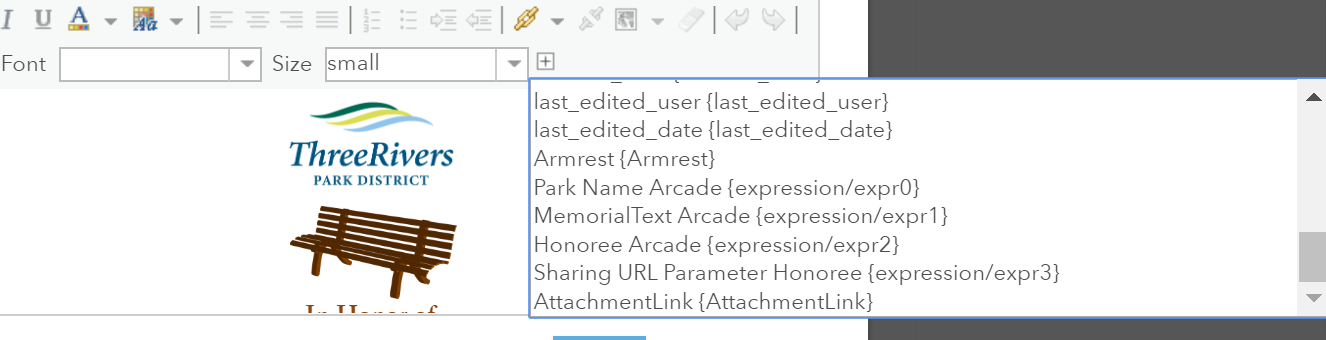
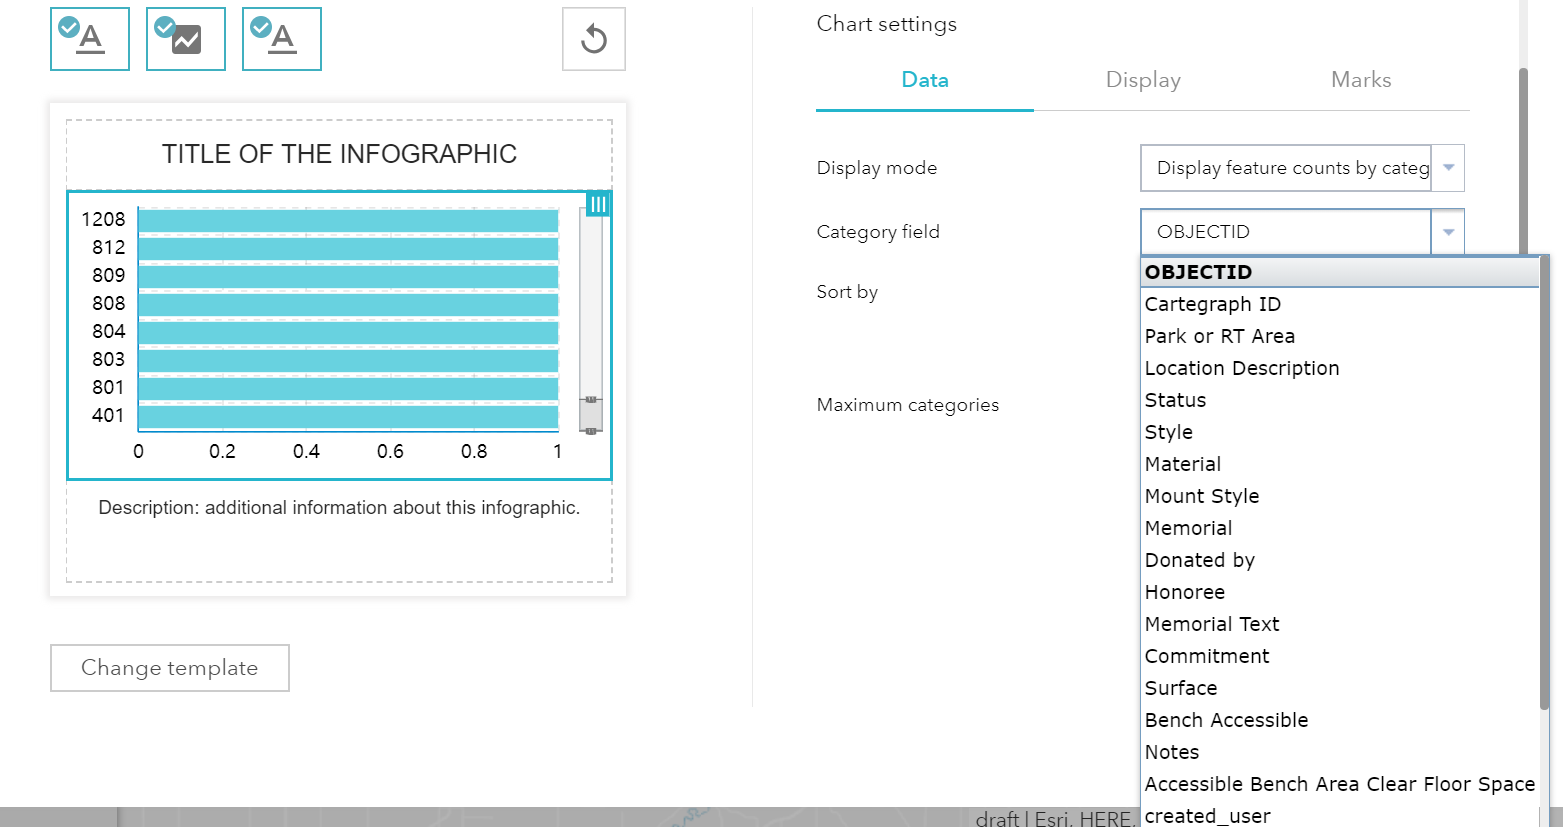
Arcade fields missing in WAB field options:
Hey Mitch Holley-
Unfortunately I don't have an update for you. The link was to a very similar ArcGIS Idea that someone had posted, but they must have since taken it down.
Thanks Sarah!
Thanks Amanda! Hopefully this will get reviewed soon!
Hi all,
I notice these replies are from around a year ago now with no update and there are quite a few other ideas focussed on the same concept. Clearly this is a significant gap in current AGOL functionality- ESRI, any plans or intentions for this to be addressed any time soon?
You must be a registered user to add a comment. If you've already registered, sign in. Otherwise, register and sign in.