Turn on suggestions
Auto-suggest helps you quickly narrow down your search results by suggesting possible matches as you type.
Cancel
- Home
- :
- All Communities
- :
- Products
- :
- ArcGIS Viewer for Flex (Retired)
- :
- ArcGIS Viewer for Flex Questions
- :
- Heat Map Widget - Time functionality
Options
- Subscribe to RSS Feed
- Mark Topic as New
- Mark Topic as Read
- Float this Topic for Current User
- Bookmark
- Subscribe
- Mute
- Printer Friendly Page
05-21-2013
07:35 AM
- Mark as New
- Bookmark
- Subscribe
- Mute
- Subscribe to RSS Feed
- Permalink
I've succesfully imported and set up the Heat Map for the ArcGIS Viewer for flex here:
http://www.arcgis.com/home/item.html?id=43daf0ffb1d34e31ad752da1340aeb40
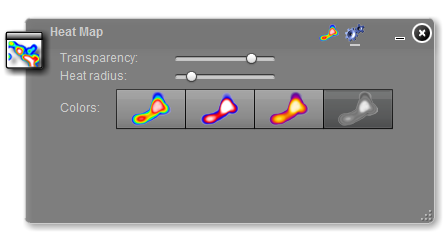
However, I am unable to get the time functionality to show up. Any ideas on why it wouldn't show up at all? I'm not sure where I change the code to point it to the date field as well.
[ATTACH=CONFIG]24546[/ATTACH]
Here is my code:
<configuration>
<layers>
<layer>
<name>Part I Offenses HeatMap</name>
<url>http://server1:6080/arcgis/rest/services/Map/Op_Crime_All_Dynamic_SP/MapServer/0</url>
<outFields>addtime,Category</outFields>
<useproxy>false</useproxy>
<useamf>true</useamf>
<defaultquery>1=1</defaultquery>
<querytemplate>Category = REPLACE_STR</querytemplate>
<types>'Aggravated Assaults','Arson','Burglary','Homicide','Larceny/Theft','Rape','Robbery','Stolen Vehicles'</types>
<type_descs>Aggravated Assaults,Arson,Burglary,Homicide,Larceny/Theft,Rape,Robbery,Stolen Vehicles</type_descs>
</layer>
</layers>
<ui>
<widget_dimensions>
<width>410</width>
<height>206</height>
</widget_dimensions>
<icons>
<base_url>widgets/HeatMap/assets/images/</base_url>
<main_icon>i_rainbow.png</main_icon>
<main_label>Main Panel</main_label>
<settings_icon>i_options.png</settings_icon>
<settings_label>Settings Panel</settings_label>
</icons>
<refresh_label>Refreshing Layer...</refresh_label>
<query>
<comp_label>Part I Offenses:</comp_label>
<heatmapquery_prompt>All Offenses</heatmapquery_prompt>
<featurecount_label>Features Contained</featurecount_label>
</query>
<timeslider>
<loop>true</loop>
<thumbcount>2</thumbcount>
<thumbmovingrate>1200</thumbmovingrate>
<dateformat>MM/DD/YYYY</dateformat>
</timeslider>
<transparency>
<comp_label>Transparency:</comp_label>
<defaulttransparency>0.8</defaulttransparency>
</transparency>
<density>
<comp_label>Heat radius:</comp_label>
<defaultdensity>15</defaultdensity>
</density>
<symbol>
<comp_label>Colors:</comp_label>
<defaulttheme>CUSTOM</defaulttheme>
<customtheme>0xEBED95,0xEDB019,0xD24F0B,0xD21813,0xBA5B6D</customtheme>
</symbol>
</ui>
</configuration>
http://www.arcgis.com/home/item.html?id=43daf0ffb1d34e31ad752da1340aeb40
However, I am unable to get the time functionality to show up. Any ideas on why it wouldn't show up at all? I'm not sure where I change the code to point it to the date field as well.
[ATTACH=CONFIG]24546[/ATTACH]
Here is my code:
<configuration>
<layers>
<layer>
<name>Part I Offenses HeatMap</name>
<url>http://server1:6080/arcgis/rest/services/Map/Op_Crime_All_Dynamic_SP/MapServer/0</url>
<outFields>addtime,Category</outFields>
<useproxy>false</useproxy>
<useamf>true</useamf>
<defaultquery>1=1</defaultquery>
<querytemplate>Category = REPLACE_STR</querytemplate>
<types>'Aggravated Assaults','Arson','Burglary','Homicide','Larceny/Theft','Rape','Robbery','Stolen Vehicles'</types>
<type_descs>Aggravated Assaults,Arson,Burglary,Homicide,Larceny/Theft,Rape,Robbery,Stolen Vehicles</type_descs>
</layer>
</layers>
<ui>
<widget_dimensions>
<width>410</width>
<height>206</height>
</widget_dimensions>
<icons>
<base_url>widgets/HeatMap/assets/images/</base_url>
<main_icon>i_rainbow.png</main_icon>
<main_label>Main Panel</main_label>
<settings_icon>i_options.png</settings_icon>
<settings_label>Settings Panel</settings_label>
</icons>
<refresh_label>Refreshing Layer...</refresh_label>
<query>
<comp_label>Part I Offenses:</comp_label>
<heatmapquery_prompt>All Offenses</heatmapquery_prompt>
<featurecount_label>Features Contained</featurecount_label>
</query>
<timeslider>
<loop>true</loop>
<thumbcount>2</thumbcount>
<thumbmovingrate>1200</thumbmovingrate>
<dateformat>MM/DD/YYYY</dateformat>
</timeslider>
<transparency>
<comp_label>Transparency:</comp_label>
<defaulttransparency>0.8</defaulttransparency>
</transparency>
<density>
<comp_label>Heat radius:</comp_label>
<defaultdensity>15</defaultdensity>
</density>
<symbol>
<comp_label>Colors:</comp_label>
<defaulttheme>CUSTOM</defaulttheme>
<customtheme>0xEBED95,0xEDB019,0xD24F0B,0xD21813,0xBA5B6D</customtheme>
</symbol>
</ui>
</configuration>
Solved! Go to Solution.
1 Solution
Accepted Solutions
05-21-2013
12:46 PM
- Mark as New
- Bookmark
- Subscribe
- Mute
- Subscribe to RSS Feed
- Permalink
Steven,
Have you made the layer time aware in ArcMap before you publish it through server:
http://help.arcgis.com/en/arcgisdesktop/10.0/help/index.html#//005z0000000p000000.htm
Regards
Anthony
Have you made the layer time aware in ArcMap before you publish it through server:
http://help.arcgis.com/en/arcgisdesktop/10.0/help/index.html#//005z0000000p000000.htm
Regards
Anthony
3 Replies
05-21-2013
12:46 PM
- Mark as New
- Bookmark
- Subscribe
- Mute
- Subscribe to RSS Feed
- Permalink
Steven,
Have you made the layer time aware in ArcMap before you publish it through server:
http://help.arcgis.com/en/arcgisdesktop/10.0/help/index.html#//005z0000000p000000.htm
Regards
Anthony
Have you made the layer time aware in ArcMap before you publish it through server:
http://help.arcgis.com/en/arcgisdesktop/10.0/help/index.html#//005z0000000p000000.htm
Regards
Anthony
05-22-2013
06:14 AM
- Mark as New
- Bookmark
- Subscribe
- Mute
- Subscribe to RSS Feed
- Permalink
hi,
im trying to devellop a widget like heat map widget but usin polygon features to represent devloppement of (vegetation , builts ) in many years
can some1 give me ideas about this ...?
tnk a lot
im trying to devellop a widget like heat map widget but usin polygon features to represent devloppement of (vegetation , builts ) in many years
can some1 give me ideas about this ...?
tnk a lot
05-24-2013
05:42 AM
- Mark as New
- Bookmark
- Subscribe
- Mute
- Subscribe to RSS Feed
- Permalink
Thanks Ad Giles, I enabled Time on the layer and republished the service and it works now!