- Home
- :
- All Communities
- :
- Products
- :
- ArcGIS Survey123
- :
- ArcGIS Survey123 Questions
- :
- Survey123 Automatic report - Insert Excel chart
- Subscribe to RSS Feed
- Mark Topic as New
- Mark Topic as Read
- Float this Topic for Current User
- Bookmark
- Subscribe
- Mute
- Printer Friendly Page
Survey123 Automatic report - Insert Excel chart
- Mark as New
- Bookmark
- Subscribe
- Mute
- Subscribe to RSS Feed
- Permalink
Hello
I am French but that does not excuse my level in English.
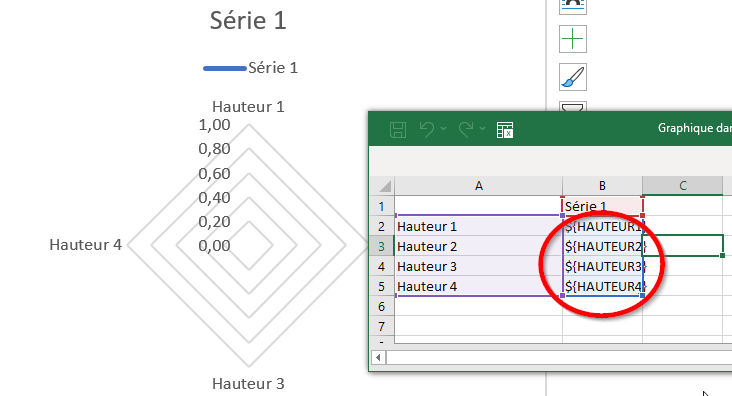
I just created an automatic report template, and I would like to know if it is possible to add graphics?
I tested on my own and didn't have good results. So before continuing my testing, I would like to check the possibility of doing it and how to do it.
I added a screenshot of the test. In the red circle, the fields of my Survey form
thanks in advance
Best regards
- Mark as New
- Bookmark
- Subscribe
- Mute
- Subscribe to RSS Feed
- Permalink
Hi @Polesig
Thanks for sharing here! The report service does not support adding analyze graphics/charts.
If you have a feature idea for Survey123 that needs fleshing out or you think will gain support from others please add it to https://community.esri.com/community/arcgis-ideas/content?filterID=contentstatus%5Bpublished%5D%7Eca...
Thanks,
Ruth