- Home
- :
- All Communities
- :
- Products
- :
- ArcGIS Survey123
- :
- ArcGIS Survey123 Questions
- :
- Re: Displaying repeats
- Subscribe to RSS Feed
- Mark Topic as New
- Mark Topic as Read
- Float this Topic for Current User
- Bookmark
- Subscribe
- Mute
- Printer Friendly Page
Displaying repeats
- Mark as New
- Bookmark
- Subscribe
- Mute
- Subscribe to RSS Feed
- Permalink
I have a survey with multiple repeats. Although the data is contained in the point feature class I need to display all repeats as their own point for different types of symbolization. How can this be done?
- Mark as New
- Bookmark
- Subscribe
- Mute
- Subscribe to RSS Feed
- Permalink
Hi Dustin,
Repeated features are stored in a related feature layer. You can view the name of your related feature layer using the 'Schema Preview' tab in Survey123 Connect:
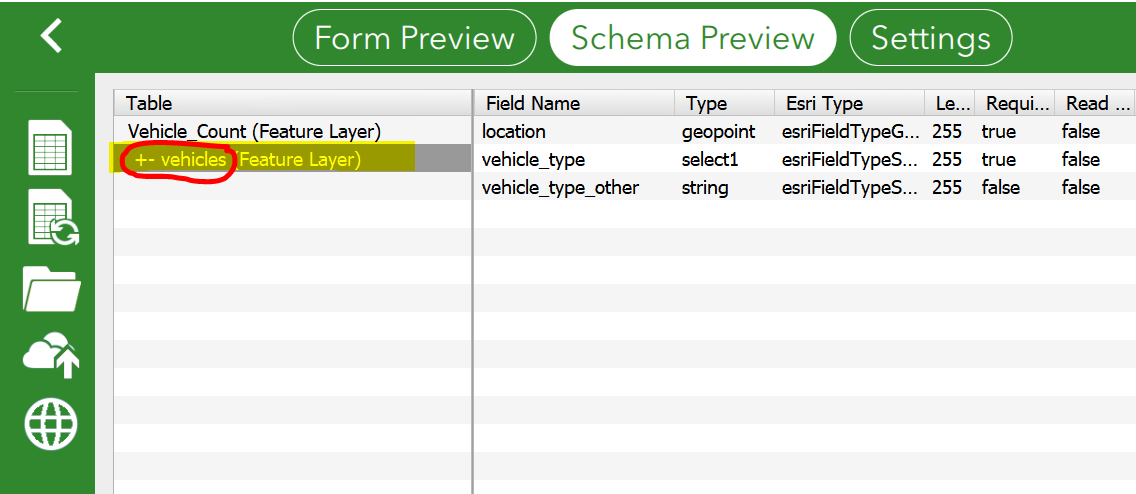
Now just add this related feature layer to a map in ArcGIS Online / Pro / Desktop and edit the symbology.
Hope this helps,
Brett
- Mark as New
- Bookmark
- Subscribe
- Mute
- Subscribe to RSS Feed
- Permalink
Brett,
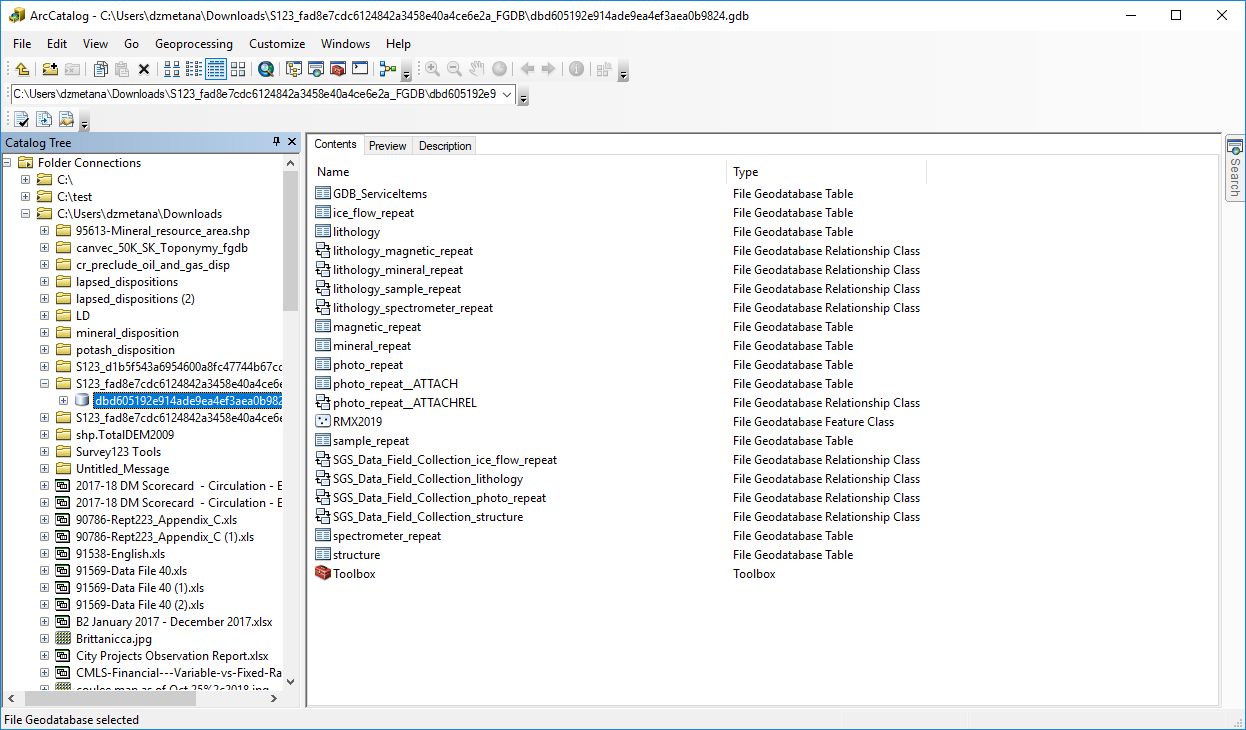
Thanks for your help. Maybe I have set my form up incorrectly. As you can see I have many repeats. The RMX2019 is the only (feature layer) that shows when bringing it into ArcPro/Map. Basically what i have is 1 point feature (from the location) and a bunch of related tables. Seen here. My form also does not have (feature layer) beside the repeats?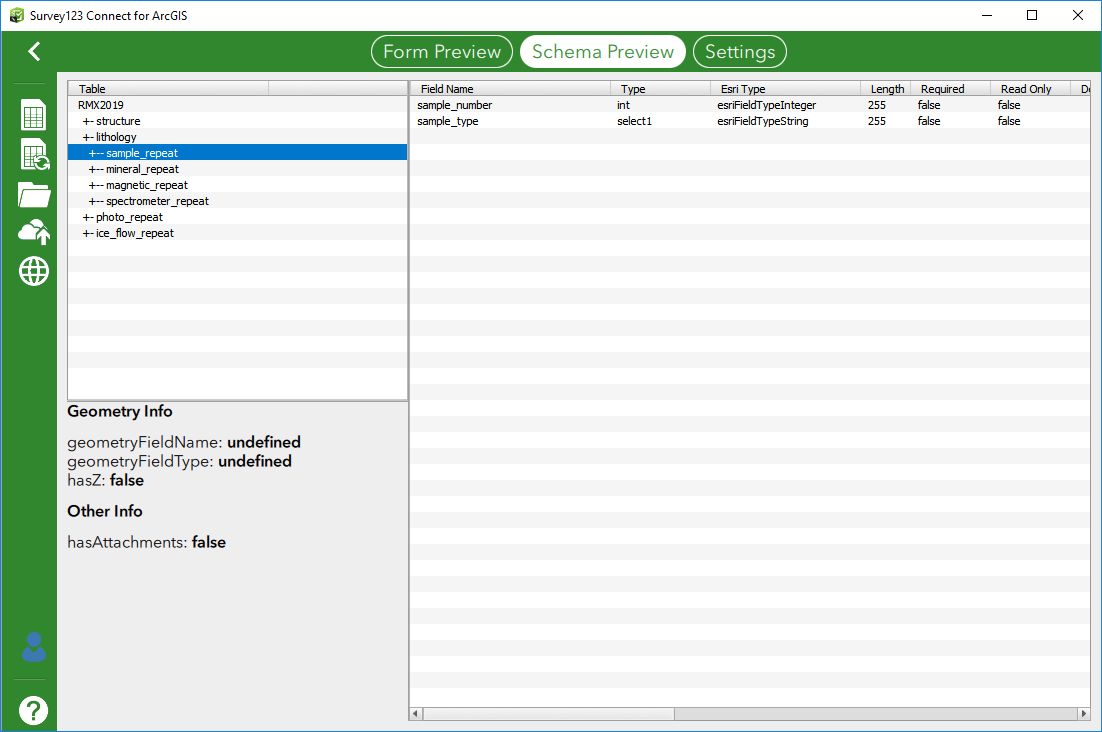
- Mark as New
- Bookmark
- Subscribe
- Mute
- Subscribe to RSS Feed
- Permalink
A Repeat will always be a table. There can only be one GPS point in the form and that becomes the FC.
I have a bunch of tables in mine and mapping an attribute of a repeat table if rather hard. You need to make that table spatial somehow. Table support is spotty.
Here are some options.
Form
-You can add a Lat and Long to the repeat table and have it calc in from the main part of the form. Then use these via XY event layer to turn them into FCs. Again not dynamic.
-If it is a specific field (like species for me) then outside the repeat add a field that has a list of all the values from the repeat. The new join () is perfect for this. join(", ", ${repeatfield}). Then you can do Def Query on the FC - for example ListField contains "Value".
If in AGOL
-Do a Join features from the table back to the FC (Feature Class). This is of course static and would need to be redone on each add.
-You can use Arcade in a web map to query the related table and display results in a popup. But it is popup only and you cannot change colors based on the field or anything. Also it will show in a attribute table put you must click each one to show the value.
Code is like this - I found a better way to write it but I cannot find it
var tbl = FeatureSetByName($datastore,"LayerName");
var sql = "SpeciesList = 'JUMO' And PrimaryKey = '" + $feature.PrimaryKey + "'";
Console(sql);
var species = Filter(tbl, sql);
var cnt = Count(species);
return iif(cnt > 0, "Yes", "No")
In ArcMap IF it is brought into a SDE or GDB
-You can use subquiers which are pretty slick
PrimaryKey IN (SELECT PrimaryKey FROM tblDetail WHERE SpeciesList = 'ARTR2')
Ops Dashboard you can do it kind of.
Hope it helps. I beat on this for a day or so and never really got it to what I wanted. Once it is a table you are pretty stuck. In the end I am going with the List in the FC using join() but not fully tested yet.
- Mark as New
- Bookmark
- Subscribe
- Mute
- Subscribe to RSS Feed
- Permalink
Hello,
I wonder if you would be able to use one of these articles below? If you complete the join, then you could add the resulting Hosted Feature Layer View into the map and symbolize the main point according to the joined table. One thing to keep in mind is that you have multiple levels of relationships built into the form. So, you would need to build a join from the deeper tables out to the main form...sample_repeat joined to lithology joined to RMX2019.
or this one
Hosted Feature Layer Views - A Practical Example
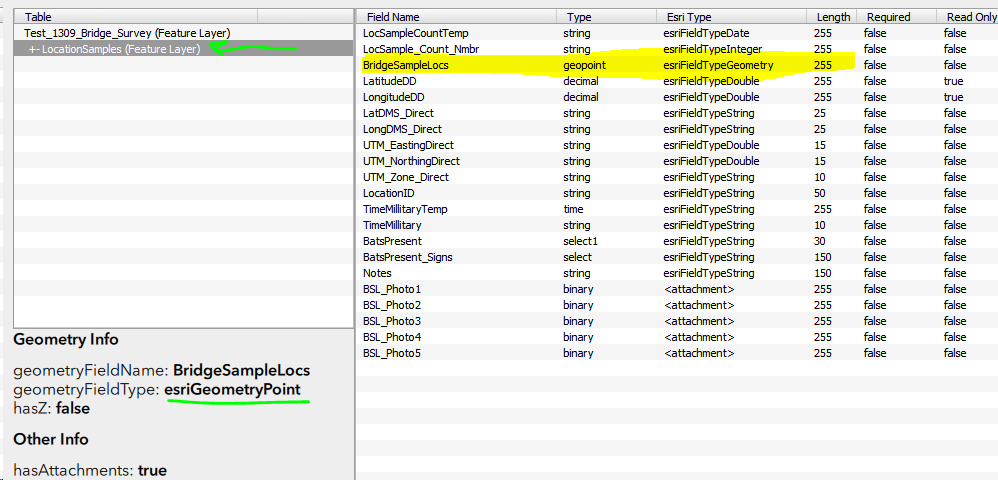
Also, I wanted to let you both know there is actually a way to capture multiple points within a Survey form and that these points will be included as a "related feature" within a survey. This means that your Main report will have a point feature created for it, but you can also have a related point feature class by placing a "Geopoint" question inside of the "repeat".
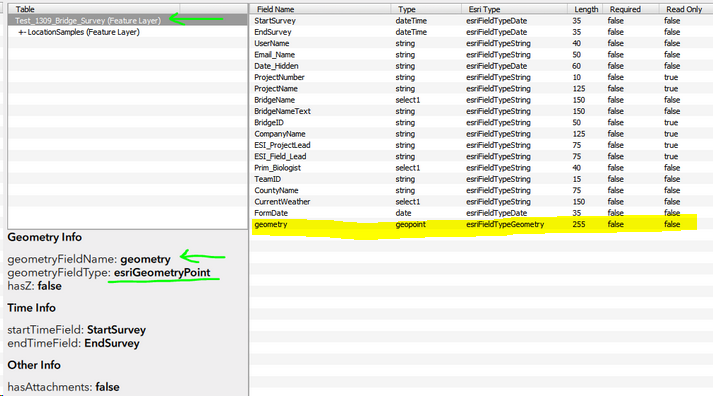
Within the screen shots below the green arrows are pointing to two feature classes; "Test_1309_Bridge_Survey" and the "LocationSamples" within the same form that are two separate point feature classes inside the Hosted Feature Layer. The "LocationSamples" is a point feature class that is related to the initial Report form and is created by adding a geopoint question into the repeat. Because a repeat will allow you to capture multiple events; you can in turn capture multiple points that are related to the main survey.
In this example, we are using a main report form for a bridge inspection, but allowing the inspectors to drop multiple sampling locations along the extent of the bridge to gain the exact location of the sample as a separate point file.
- Mark as New
- Bookmark
- Subscribe
- Mute
- Subscribe to RSS Feed
- Permalink
Hi Doug,
Just to correct what you replied with above, a repeat is not always a table. A repeat can also be a layer if it contains a geopoint question. It is possible to have the parent feature layer, with several related feature layers, without any related tables. Layers will be created instead of tables if the repeat has geometry (a geopoint question).
You can therefore capture the location of the parent feature, and then capture different locations for each repeat record in each related layer.
Phil.
- Mark as New
- Bookmark
- Subscribe
- Mute
- Subscribe to RSS Feed
- Permalink
Thanks Phil I actually did not know you could do that now. Sorry about that.
This is actually really cool and it totally changed how I may layout my schema now. It may really help me get around some table support issues in ArcMap and AGOL. (As you can see by all the crazy stuff I tried above.)
Thanks!
- Mark as New
- Bookmark
- Subscribe
- Mute
- Subscribe to RSS Feed
- Permalink
Dustin, you can have multiple geopoints in a survey if they're within a repeat. They will then show up as individual point features on a map.
Try This: https://arcg.is/1D1mff
The "Observations" repeat will show up as a related table & related feature layer. In AGOL, each point feature in the repeat has it's own lat/long with a caption and image attachment.
In the XLS:
| begin repeat | photomap | <center><b>Observation</b></center> |
| image | image | <center><b> Image </b></center> |
| text | photocaption | <center><b> Image Caption </b></center> |
| geopoint | geopoint | <center><b>Image Location</b></center> |
| hidden | imagelocation | Lat/Long |
| hidden | googlelink | View in Google Maps |
| end repeat |
- Mark as New
- Bookmark
- Subscribe
- Mute
- Subscribe to RSS Feed
- Permalink
Hi Dustin,
Are you just wanting to assign the location of your parent 'RMX2019' feature layer record to the records within your related tables? We have an issue logged to fix this (it's currently broken), but the approach is to bring the XY coordinates of a geopoint question (parent feature layer) to all records within a repeat (related table) using the Pulldata function eg:
Brett
- Mark as New
- Bookmark
- Subscribe
- Mute
- Subscribe to RSS Feed
- Permalink
Yes, I want to be able to display each related table with the same XY cooridinates of the parent layer.
It seems redundant to assign a geopoint to every repeat record since they will all be at the same location of the parent layer.
I need to be able to symbolize each repeat; in my case i could have 25 records (repeats) on that same XY parent layer, and finding it difficult.
I could assign the geopoints for now for some testing.
If i wanted to pulldata how would that look?
What would the related tables look like in catalog/Pro view?
ie. My screen shot i could have 5 samples on the same point. i need to symbolize all 5 samples with different symbol for map production.
I manually move them at final production for visibility. (could spatial views work here instead)