- Home
- :
- All Communities
- :
- Products
- :
- ArcGIS Spatial Analyst
- :
- ArcGIS Spatial Analyst Questions
- :
- Why do I have spikes in my raster images in ArcSce...
- Subscribe to RSS Feed
- Mark Topic as New
- Mark Topic as Read
- Float this Topic for Current User
- Bookmark
- Subscribe
- Mute
- Printer Friendly Page
Why do I have spikes in my raster images in ArcScene -how do I remove them?
- Mark as New
- Bookmark
- Subscribe
- Mute
- Subscribe to RSS Feed
- Permalink
Hello GeoNet team
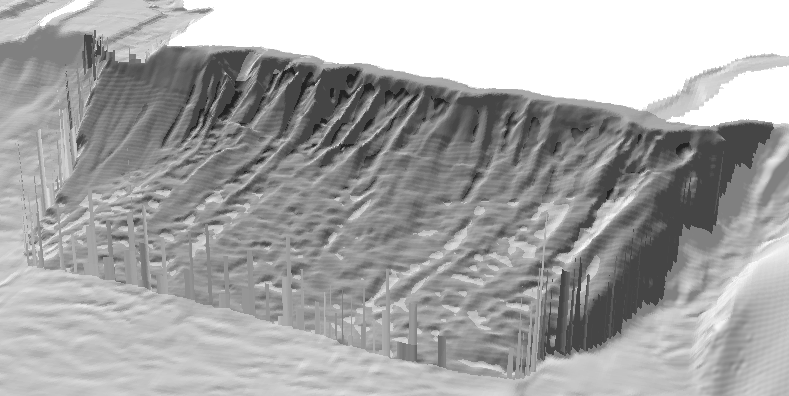
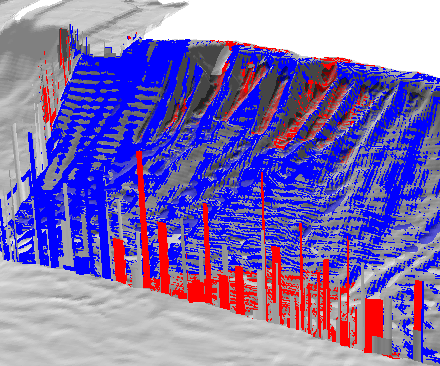
I am working on a a cut fill operation to determine the volume of a possible submarine landslide. I am using both and ArcMap to process and ArcScene to view my results in 3D. I've completed my processing steps in ArcMap and when opening my data in ArcScene I get these interesting spike anomalies> any ideas why?
I thought it might be a result of the fact that my original image with 2m resolution and I was doing my trend in 5 m resolution. So I changed that and still get these spikes. I wonder if this is common, as I did not see this question when searching.
If someone could please let me know what I might do to clean this up, I would be grateful.
Thanks
Jess
See image below
Solved! Go to Solution.
Accepted Solutions
- Mark as New
- Bookmark
- Subscribe
- Mute
- Subscribe to RSS Feed
- Permalink
Hi Jess,
What I wanted you to do was to use identify and all raster participating in the Cut Fill that resulted in the spikes (so the two input rasters and the output raster). Click on any part where you know there is a spike. Examine the values of the input raster and output. Is the output value what you suspect based on the input values? If so, are the input values what you would expect. If not, check the method used to create them.
I don't really understand why you created the rasters the way you did. If you have point observations (multibeam) from before and after the landslide, use the same method to interpolate them. Perhaps using Create Terrain—Help | ArcGIS Desktop . In case you are using the same surface information and applying two different interpolations, I don't think that will yield a before and after situation.
- Mark as New
- Bookmark
- Subscribe
- Mute
- Subscribe to RSS Feed
- Permalink
what are the class values (colors)?
they seem to be occurring along the edges, so what were the parameters for the cut fill?
- Mark as New
- Bookmark
- Subscribe
- Mute
- Subscribe to RSS Feed
- Permalink
When you identify some pixels that present these spikes (2D in ArcMap) what values do you have in the input rasters and output cut fill raster?
- Mark as New
- Bookmark
- Subscribe
- Mute
- Subscribe to RSS Feed
- Permalink
Hi Dan
I am not too sure what you are referring to. However, short outline of my method:
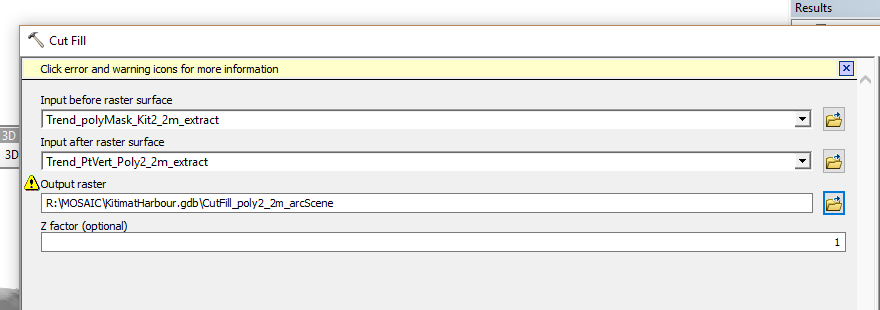
Created a polygon around my potential slide area. Using this polygon for my before and after raster in the cut fill.
1)After Polygon>vertices to points>extract by mask (using bathymetry at 2 m resolution -to get depth at these points) > Trend Analysis ( 2 m polynomial 3)>extract by mask (uing original polygon) >CutFill after raster
2)Before polygon: I tried two methods; 1: extract by mask (using bathymetry (multibeam) layer at 2m res -using this as my before raster in the cut fill
Method 2: Extract by mask (using 2 m resolution Bathymetry) > Raster to points> Trend>Extract by mask > Cut Fill (before raster)
I included a couple images as I am not too sure what you might need to see what I may have done wrong.
My Multibeam Layer I used for processing.

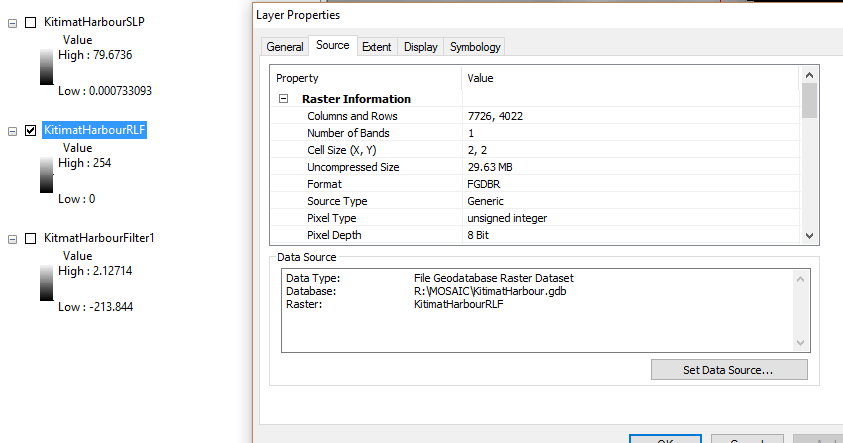
My Relief image is set differently -so as you can see below -@Curtis Price mention something about this, but I am not sure what I need to do??
In regards to Xander Bakker - I get no values when I click on the spikes in ArcScene (see below) and but get result for them in the actually layer.And I get values for all the pixels in 2D view

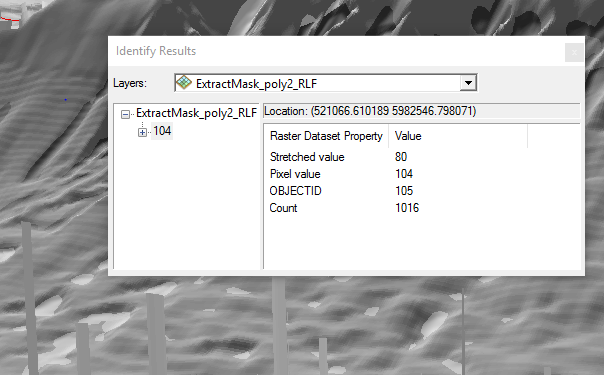
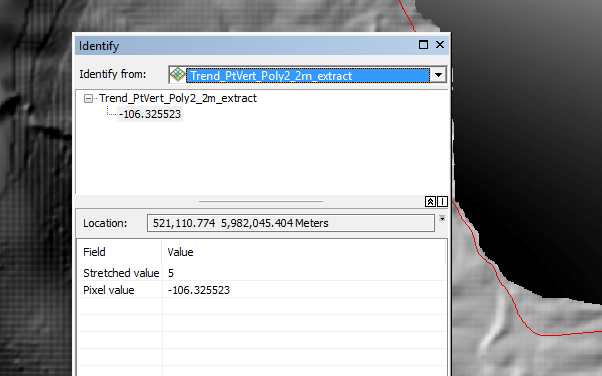 Taking from a point on the edge of the polygon where spikes appear in 3D.
I am not too sure who I may go about sorting this out. I am hoping someone can assist.
Thanks kindly
Jess
- Mark as New
- Bookmark
- Subscribe
- Mute
- Subscribe to RSS Feed
- Permalink
Hi Jess,
What I wanted you to do was to use identify and all raster participating in the Cut Fill that resulted in the spikes (so the two input rasters and the output raster). Click on any part where you know there is a spike. Examine the values of the input raster and output. Is the output value what you suspect based on the input values? If so, are the input values what you would expect. If not, check the method used to create them.
I don't really understand why you created the rasters the way you did. If you have point observations (multibeam) from before and after the landslide, use the same method to interpolate them. Perhaps using Create Terrain—Help | ArcGIS Desktop . In case you are using the same surface information and applying two different interpolations, I don't think that will yield a before and after situation.
- Mark as New
- Bookmark
- Subscribe
- Mute
- Subscribe to RSS Feed
- Permalink
Hi Xander
Thanks for the message. I did use the identity tool to view the pixel of the spike for all layers, and no data came up in the spikes, yet when I viewed the later in ArcMap on the same pixel the value looks good. Anyhow, I went back after reading the replies and switch which layer I was draping over and switch to the original multi-beam and it worked -no spikes. I was trying to drape the images over the relief and the extracted multi-beam by my polygon. I guess it didn't like the edge values?
I regards to my method, I am comparing this to another method. I actually only have multi-beam for the before landslide. What I am trying to do is estimate the volume that would occur if the landslide did happen. I realize my method might be wrong, but I am trying to see if this would work. I use the original multi-beam as my before and then created an proposed after rasters. I realize this is an additional question, but does this make sense? I'm open to other suggestions.
cheers
Jess
- Mark as New
- Bookmark
- Subscribe
- Mute
- Subscribe to RSS Feed
- Permalink
You may do better if you set the cell size and snap raster to match the raster you are draping onto before you do the interpolation run. This will make your output raster cells exactly match up with your elevation cells.