- Home
- :
- All Communities
- :
- Products
- :
- ArcGIS Spatial Analyst
- :
- ArcGIS Spatial Analyst Questions
- :
- weighted average of overlapping polygons
- Subscribe to RSS Feed
- Mark Topic as New
- Mark Topic as Read
- Float this Topic for Current User
- Bookmark
- Subscribe
- Mute
- Printer Friendly Page
weighted average of overlapping polygons
- Mark as New
- Bookmark
- Subscribe
- Mute
- Subscribe to RSS Feed
- Permalink
I'm trying to calculate a weighted average using the summary statistics tool using median HH Income census tracts and a single polygon for a target area. So far I have been able to calculate the percentage of overlap for the target area and census tracts, however I'm a bit stuck on the summary statistics tool. I keep getting a frequency of 1 so I'm unable to calculate the weighted average. My statistical field is the percentage of target area times MHH Income, and case field is the Tract Name. Here is a snapshot of the data:
- Mark as New
- Bookmark
- Subscribe
- Mute
- Subscribe to RSS Feed
- Permalink
The image seems to have two vector layers, yet you have posted this in the Spatial Analyst Place... If this is in error, it can be moved to Geoprocessing for correct exposure.
In any event. You have a need to bring over the attributes during the overlay process. I would advise you to look at the images and text in
An overview of the Overlay toolset—Help | ArcGIS for Desktop
to decide which approach would yield the results you need. You need the area and pop from the census data and you need to get the geometric intersection and the attributes from the overlay process of the buffer with the census data. If you have the appropriate license level, then you have options.
- Mark as New
- Bookmark
- Subscribe
- Mute
- Subscribe to RSS Feed
- Permalink
Yes, I have created the percentage of overlap using the Tabulate Intersection tool and used the intersect tool to combine the two layers. Now I'm at Summary statistics.
- Mark as New
- Bookmark
- Subscribe
- Mute
- Subscribe to RSS Feed
- Permalink
what is in the table? perhaps a simple field calculation is what is needed... that is the point I was making about doing the appropriate overlay method... some retain attributes, some geometry, some both.
- Mark as New
- Bookmark
- Subscribe
- Mute
- Subscribe to RSS Feed
- Permalink
Census Tracts have income info, target area has no data, just area name. Intersect retains attributes from both layers, but not geometry.
- Mark as New
- Bookmark
- Subscribe
- Mute
- Subscribe to RSS Feed
- Permalink
if you calculate the geometric properties in the table prior to doing the overlay then the information would be there... if the destination is into a file geodatabase then you would automatically have a shape_area field facilitating the calculation of proportional areas and hence populations
- Mark as New
- Bookmark
- Subscribe
- Mute
- Subscribe to RSS Feed
- Permalink
Yes I am aware of that, as I have stated I have already calculated the percent area of overlap, having issues with the summary statistics tool.
Regards
- Mark as New
- Bookmark
- Subscribe
- Mute
- Subscribe to RSS Feed
- Permalink
- top left census area Lake claire park... we will call this A
- buffer... call it B
- appropriate overlay the B with A yielding C
A_area .... calculated previously or exists already
A_pop ..... exists already
C_area .... calculate or exists as the result of the appropriate overlay tool
C_pop = A_pop * (C_area/A_area)
So I am not clear where summary statistics comes into play.
I obviously have this all wrong, I though you were looking to get an estimate of the number of people in the area of overlap with the different intersecting areas along the buffer.
- Mark as New
- Bookmark
- Subscribe
- Mute
- Subscribe to RSS Feed
- Permalink
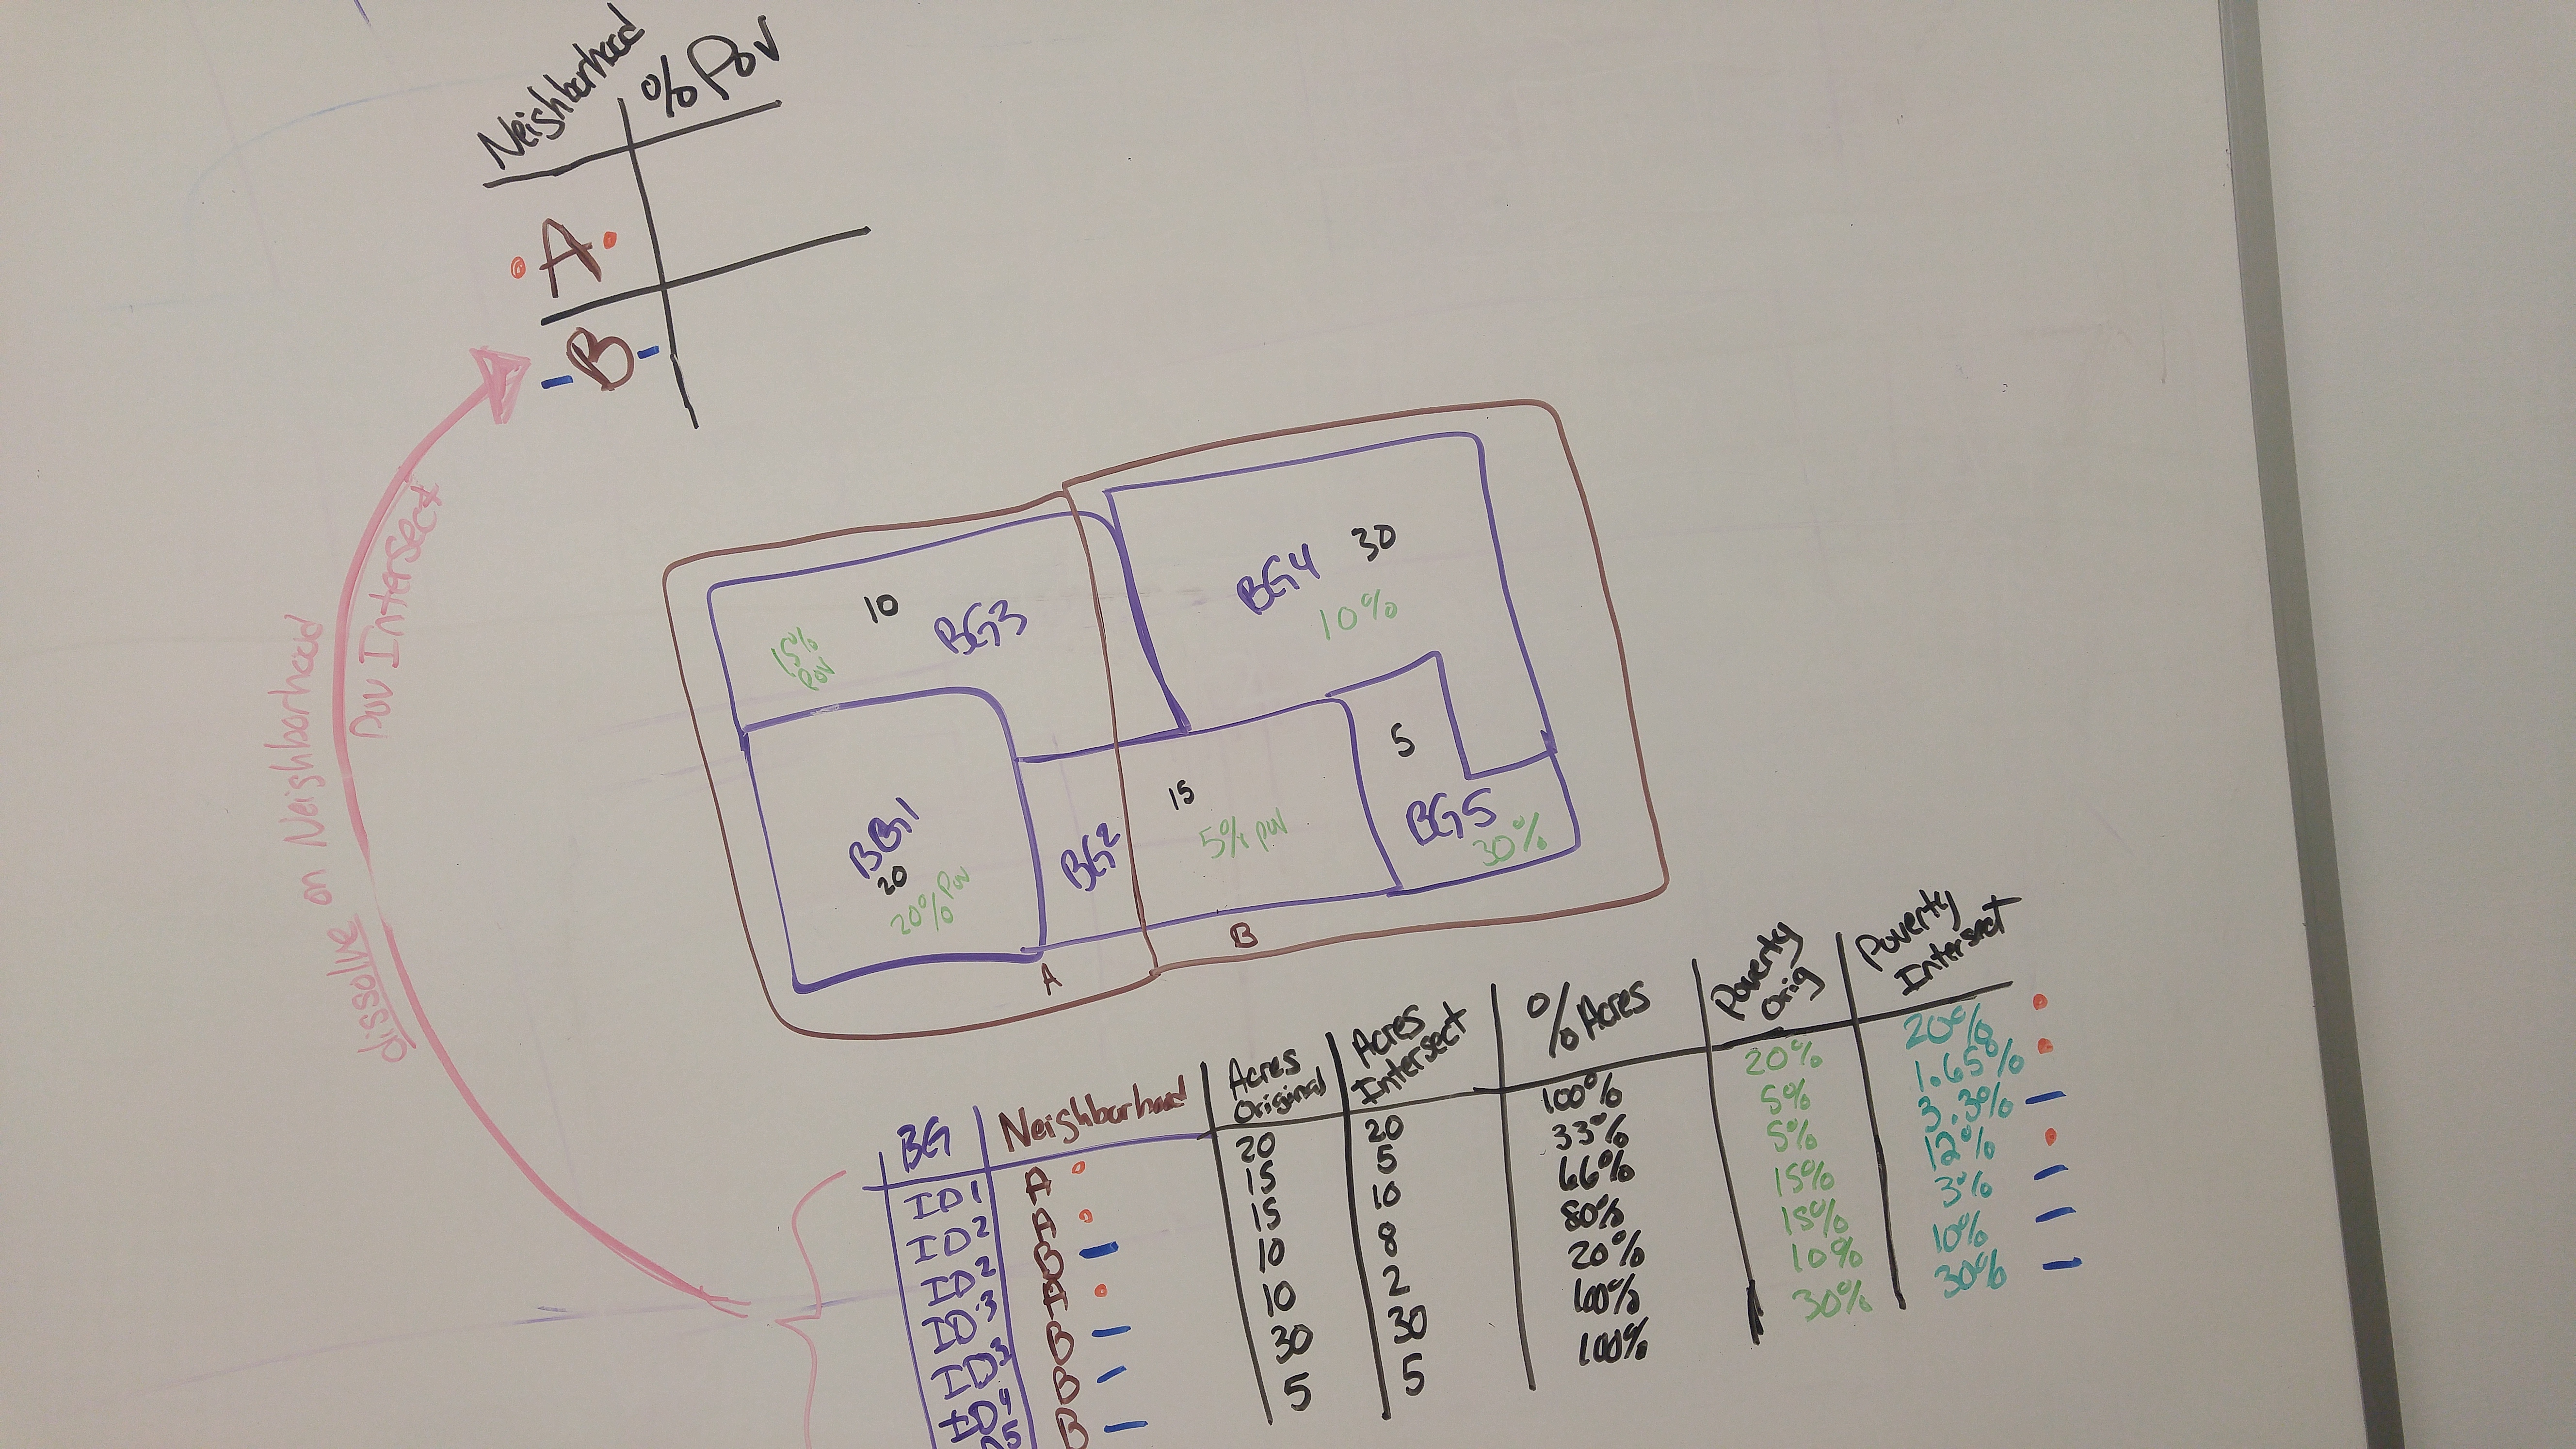
I also have this question however my question is how to do this with percentages (example Census Tract is 20% poverty) instead of whole numbers such as with population - the last reply by Dan Patterson works when you have numbers. In my case I am trying to find say the overall percent poverty of a Neighborhood which overlaps with Tracks/ Blocks.
Attached is a picture to explain conceptually -
example Neighborhood A
- BG1 (20% poverty) is 100% in A
- BG2 (5% poverty) is 5% in A
- BG3 (15% poverty) is 80% in A
Thus the overall poverty in A should be close to 20% but less than 20%. The 5% poverty should factor in at a 5% weight.
When I dissolve fields on the Neighborhood how do I do the math? AT this point IF that last column in the picture was numbers - I just dissolve and summarize those numbers - but these are percentages of poverty ... Please Help! -Many Thanks!
- Mark as New
- Bookmark
- Subscribe
- Mute
- Subscribe to RSS Feed
- Permalink
Ok, I figured it out! 
Basically you have to turn those percentages into numbers - usually with census data you have the total population and you/I should use that. For this example I set the population to 100 - then I calculate Total Number of {People in Poverty} For Example BG2(ID2) has 5% Poverty. I have to turn that into Number of People in Poverty so using 100 as the population I proportion out the total population to the ratio of acres.
So:
- 33 people (33% of the acerage) are in intersect of BG2 and Neighborhood A -
- and 66 people (66% of the acreage) are in the intersect of BG2 and Neighborhood B. -
- Of the 33 people, 5% are in Poverty which is 1.65
- Of the 66 people, 5% are in Poverty which is 3.3
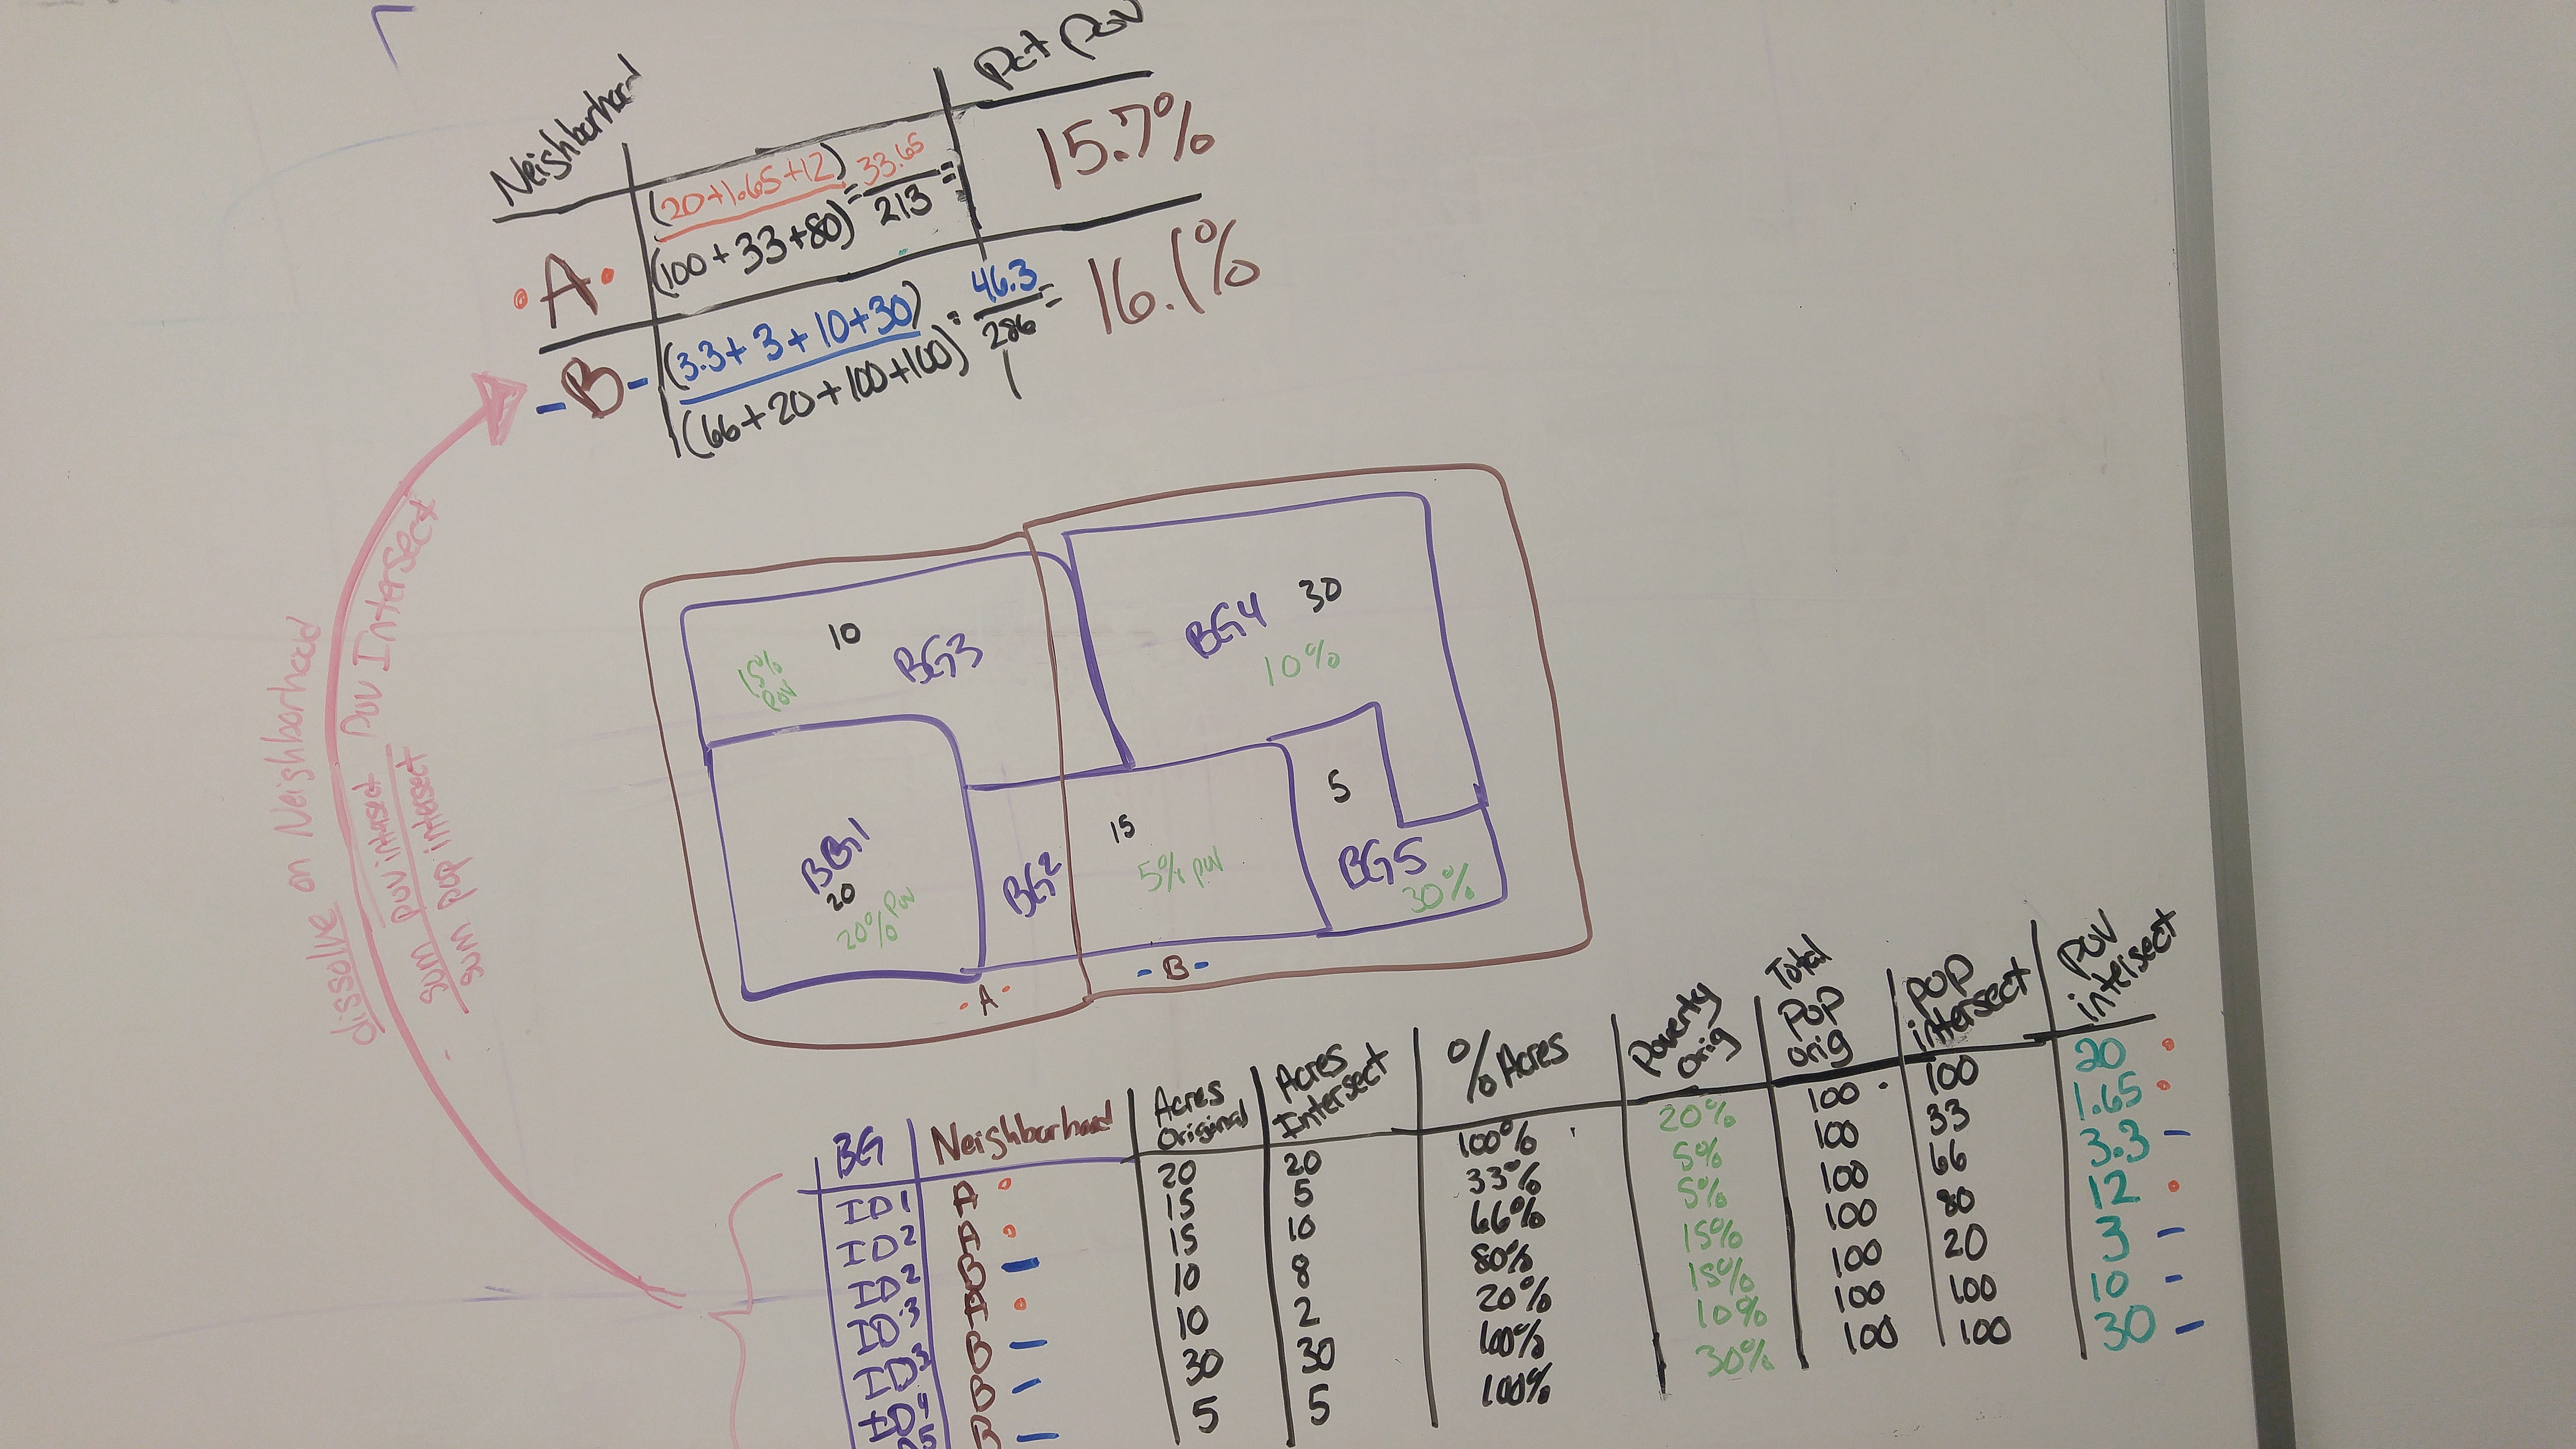
- and so on
Then you Summarize all Neighborhood A Number of People in Poverty and Divide by the Total Intersected Population
However There is also the Enrich tool in ArcGIS Pro  Data apportionment—ArcGIS REST API: GeoEnrichment Service | ArcGIS for Developers