- Home
- :
- All Communities
- :
- Products
- :
- ArcGIS Spatial Analyst
- :
- ArcGIS Spatial Analyst Questions
- :
- Re: Struggling with Smoothing Contour Lines
- Subscribe to RSS Feed
- Mark Topic as New
- Mark Topic as Read
- Float this Topic for Current User
- Bookmark
- Subscribe
- Mute
- Printer Friendly Page
Struggling with Smoothing Contour Lines
- Mark as New
- Bookmark
- Subscribe
- Mute
- Subscribe to RSS Feed
- Permalink
I am working with my middle school kids on a science project (I am the tech teacher with a laser cutter). In class, they are doing relief maps with cardboard. The science teacher has seen some of the stuff that came out of my class, so he challenged me with bathymetric maps cut out on the laser. I have tried everything I can find online, but I can't get the contours to "smooth." Every time I smooth them (increase the neighborhood size in Focal Statistics), I lose some of the bays and inlets...but it is still "jagged."
I have all the DEM data loaded, and have been working with the kids on the elevation intervals...all that is working great.
The issue come when I try to process things in Focal Statistics. I have gone from 1-25 on the neighborhood sizes, tried "rectangle" (and all the others), changed "map" to "cell," changed "mean" to a few of the others, etc. I have probably process the elevations no fewer than 50 times.
The only thing I have not been successful with is Python. I tried some sample scripts I found, but it gave me an error (I am not a programmer...so I an struggling to debug it).
My solution was to export and use my Illustrator skills to smooth things....but I ended up with the "banding" issue. That led me down a whole other rabbit hole. I finally got things "working" and we burned our first map. It is not bad (we like the ruggedness of the lines), but since I was the "lead" on this project, the kids now want to focus on another part of Washington and make their own. The easiest way for the kids to do this is use my DEM data we already processed, but when they zoom into the area of interest, things get VERY pixilated. Since they are 12-14, my goal is to get the ArcMap file dialed in with nice smooth contours (can work with them to customize if needed), export it to AI, then let the kids do their magic from there.
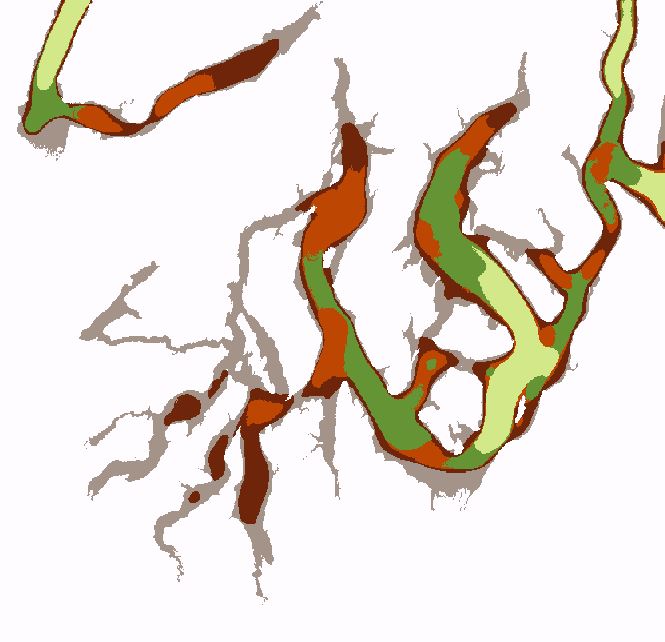
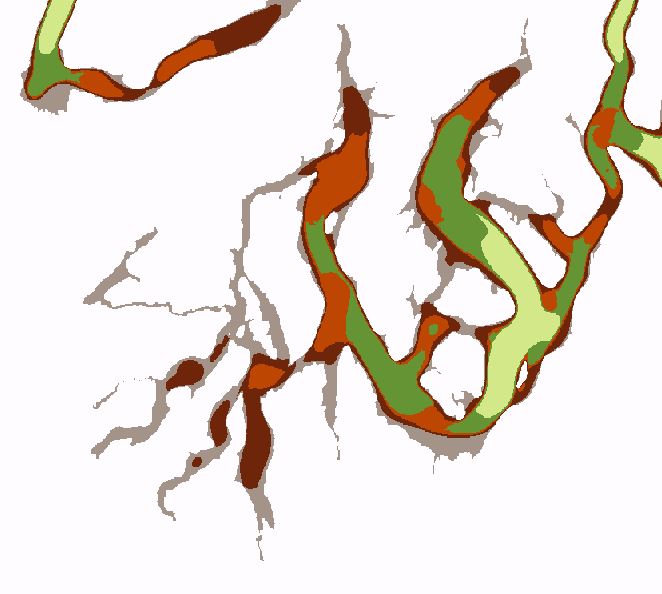
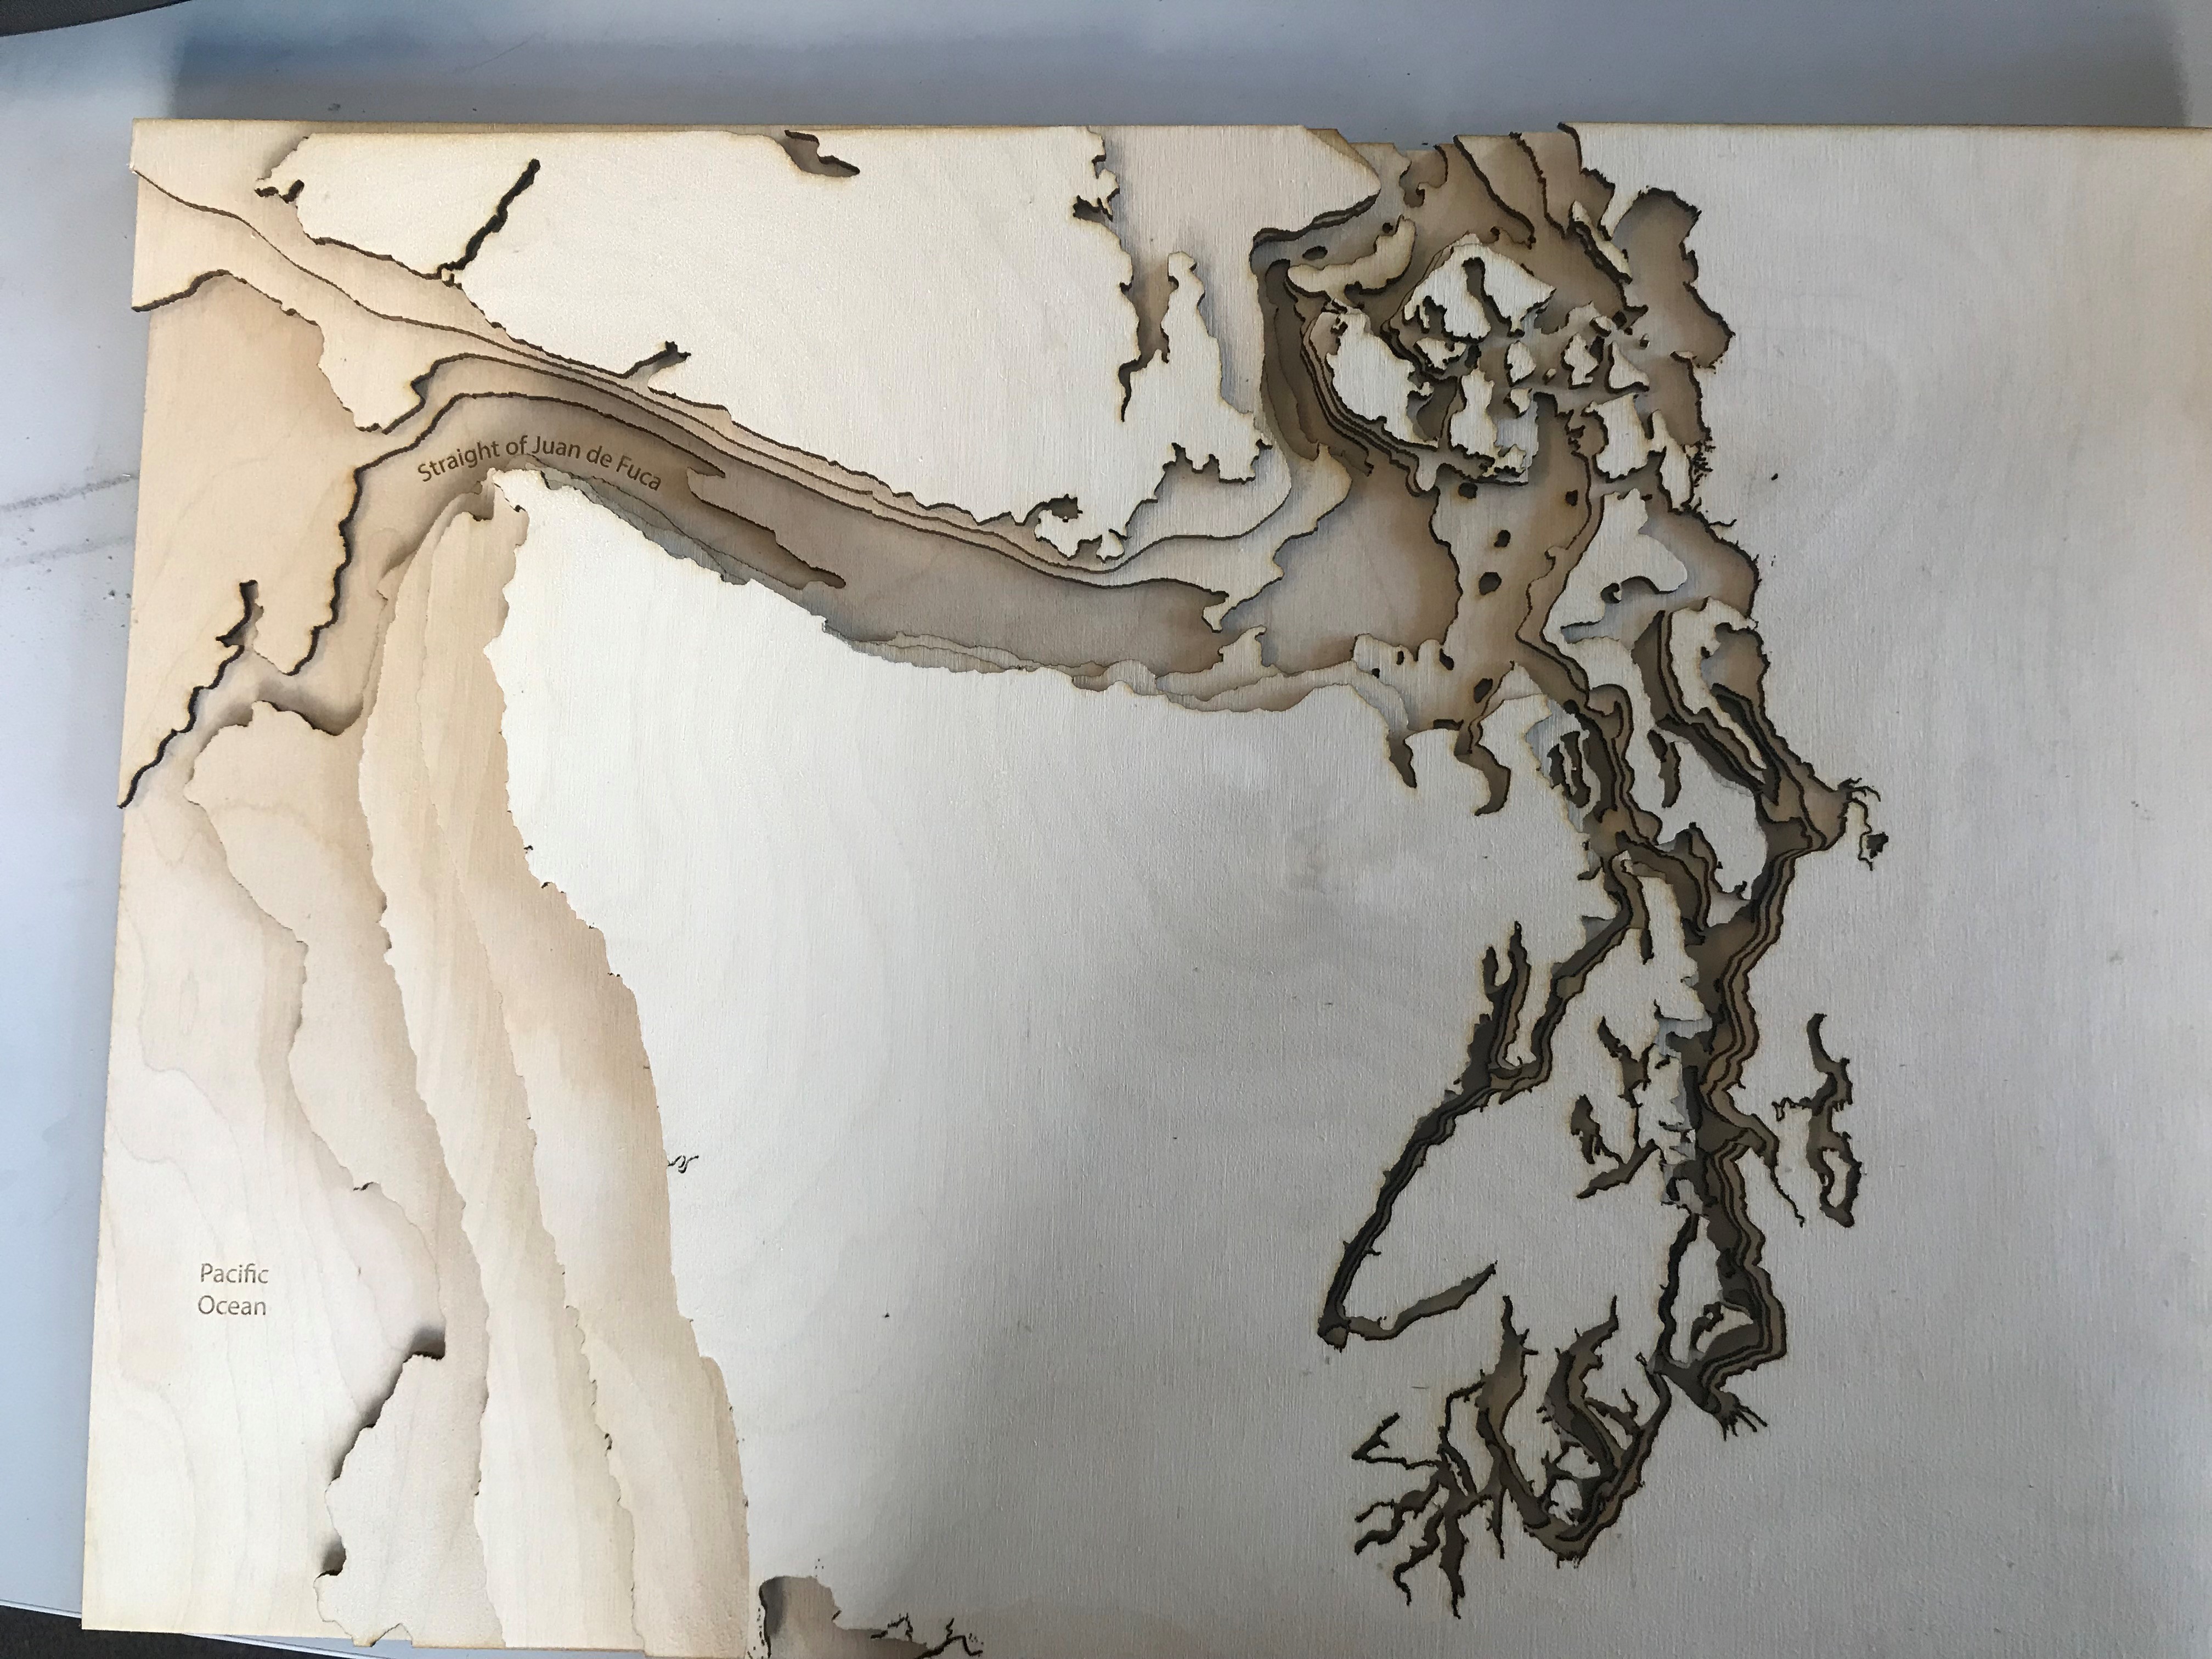
ANY help on how to get these kids going again would be appreciated. I think if I can get smooth contour lines, I will be OK with the rest. The below pictures are:
1. Wide view of the bathymetric contours
2. close-up (not smooth)
3. Same view after changing the neighborhood from 3 to 10...pixels gone...but not smoothed?
4. The project so far
I have been following these instructions as my guide...but I think he uses an older version (I am on 10.6:http://www.instructables.com/id/Lasercut-3D-Topographic-Wood-Maps/
I am hoping it is just something I am overlooking....????
Thanks in advance,
Jeff

-
- Mark as New
- Bookmark
- Subscribe
- Mute
- Subscribe to RSS Feed
- Permalink
Did you try Smooth Line—Help | ArcGIS Desktop ?
- Mark as New
- Bookmark
- Subscribe
- Mute
- Subscribe to RSS Feed
- Permalink
I did look into that for an hour or so, but could not figure out how to add the contour layer to be smoothed. In other Spatial Analysis tools, I can select the layer, Smooth Line requires a file to be opened. Googling again to see if I can get that feature figured out. Thanks for the quick reply...
- Mark as New
- Bookmark
- Subscribe
- Mute
- Subscribe to RSS Feed
- Permalink
To clarify...I was going through the "Smooth Line Cartography Tool." That is where I am struggling to find out how to select a file to smooth. I also found some help using the "advanced editor" toolbar ( http://web.mit.edu/12.114/05_fall/www/tutorials/digital_tutorials/smooth_lines/smooth_line.htm ) but my tools are all grayed out (I think this feature is for lines you actually draw).
- Mark as New
- Bookmark
- Subscribe
- Mute
- Subscribe to RSS Feed
- Permalink
The tool Smooth Line—Help | ArcGIS Desktop requires a line featureclass as input. Looks like you have only raster data. I assume you did not create contour lines from your DEM/DTM using Contour—Help | ArcGIS Desktop . From the pictures in the explanation I deduce that only the Reclassify—Help | ArcGIS Desktop was used. The result of this tool is still a raster (where ranges of height values are classified as the same height class). Please try the contour tool on your DEM/DTM.
- Mark as New
- Bookmark
- Subscribe
- Mute
- Subscribe to RSS Feed
- Permalink
Correct, I did not use the contour tool (on this file, but did start that way originally). I did reclassify the heights through - Properties>Symbology>Classified. The depth of the Puget sound is around 900ft, so when I used the contour tool, it gave A LOT contours. I tried different intervals (ie: 200ft), which would give me 5 layers (perfect). However, since the first contour is 0-200, it eliminates a lot of the gentle slope off the shorelines. The way I have it classified is 0 to -5, -5 to -25, -25 to -50, -50 to -100, -100 to -200, and -200 to -1000. The kids needed to have a more detail in the upper portions, so even though it is not proportionate...it makes for a better map for them. Additionally, contours are added above sea-level, which creates another set of issues (been trying to find out how to delete contours)....
- Mark as New
- Bookmark
- Subscribe
- Mute
- Subscribe to RSS Feed
- Permalink
So, when you change the symbology of a raster into classified ranges, the layer is still raster and the values remain the same since you just change the way the layer is visualized. If you have determined that the list " 0, -5, -25, -50, -100, -200, -1000" provides a reasonable result you can use the tool: Contour List—Help | ArcGIS Desktop . Be aware that when using different interval values, this should be reflected in the width of the wood layers to give a natural result. If you don't do that the shores will appear with a much higher slope in the final result.
- Mark as New
- Bookmark
- Subscribe
- Mute
- Subscribe to RSS Feed
- Permalink
I struggled with the fact that the contour would not be proportionate to the wood thickness. That will be the next round of projects. I will look into the Contour List option and see what comes from it. Thanks!
- Mark as New
- Bookmark
- Subscribe
- Mute
- Subscribe to RSS Feed
- Permalink
Please read Steve Lynch ![]() 's reply in the same issue
's reply in the same issue
https://community.esri.com/thread/206630-trouble-smoothing-dem-for-contour-lines#comment-737224
and other one for smooth raster https://community.esri.com/thread/190376-smooth-a-raster-layer
- Mark as New
- Bookmark
- Subscribe
- Mute
- Subscribe to RSS Feed
- Permalink
You said "pixellation" was the issue, maybe you may want to look at classifying the bathymetric data (using Reclassify) and using the Boundary Clean tool on the results before scribing.