- Home
- :
- All Communities
- :
- Products
- :
- ArcGIS Spatial Analyst
- :
- ArcGIS Spatial Analyst Questions
- :
- Re: Identify regions in common on two rasters
- Subscribe to RSS Feed
- Mark Topic as New
- Mark Topic as Read
- Float this Topic for Current User
- Bookmark
- Subscribe
- Mute
- Printer Friendly Page
Identify regions in common on two rasters
- Mark as New
- Bookmark
- Subscribe
- Mute
- Subscribe to RSS Feed
- Permalink
Hi,
Am new here so excuse me if my question is naive! I have a terrain-filter raster in pink and another raster filter in purple (shown overlying the first). I am only interested in the areas where the pink and purple are connected. In other words, I want to remove all the purple areas that are not associated with (adjacent to or overlayed) the pink regions, leaving just the areas where the two filters touch. I then want to merge them together to make a filter combining both (I do not need to separate the pink from the purple - I just want to identify regions where the two filters are connected.
How can I achieve this?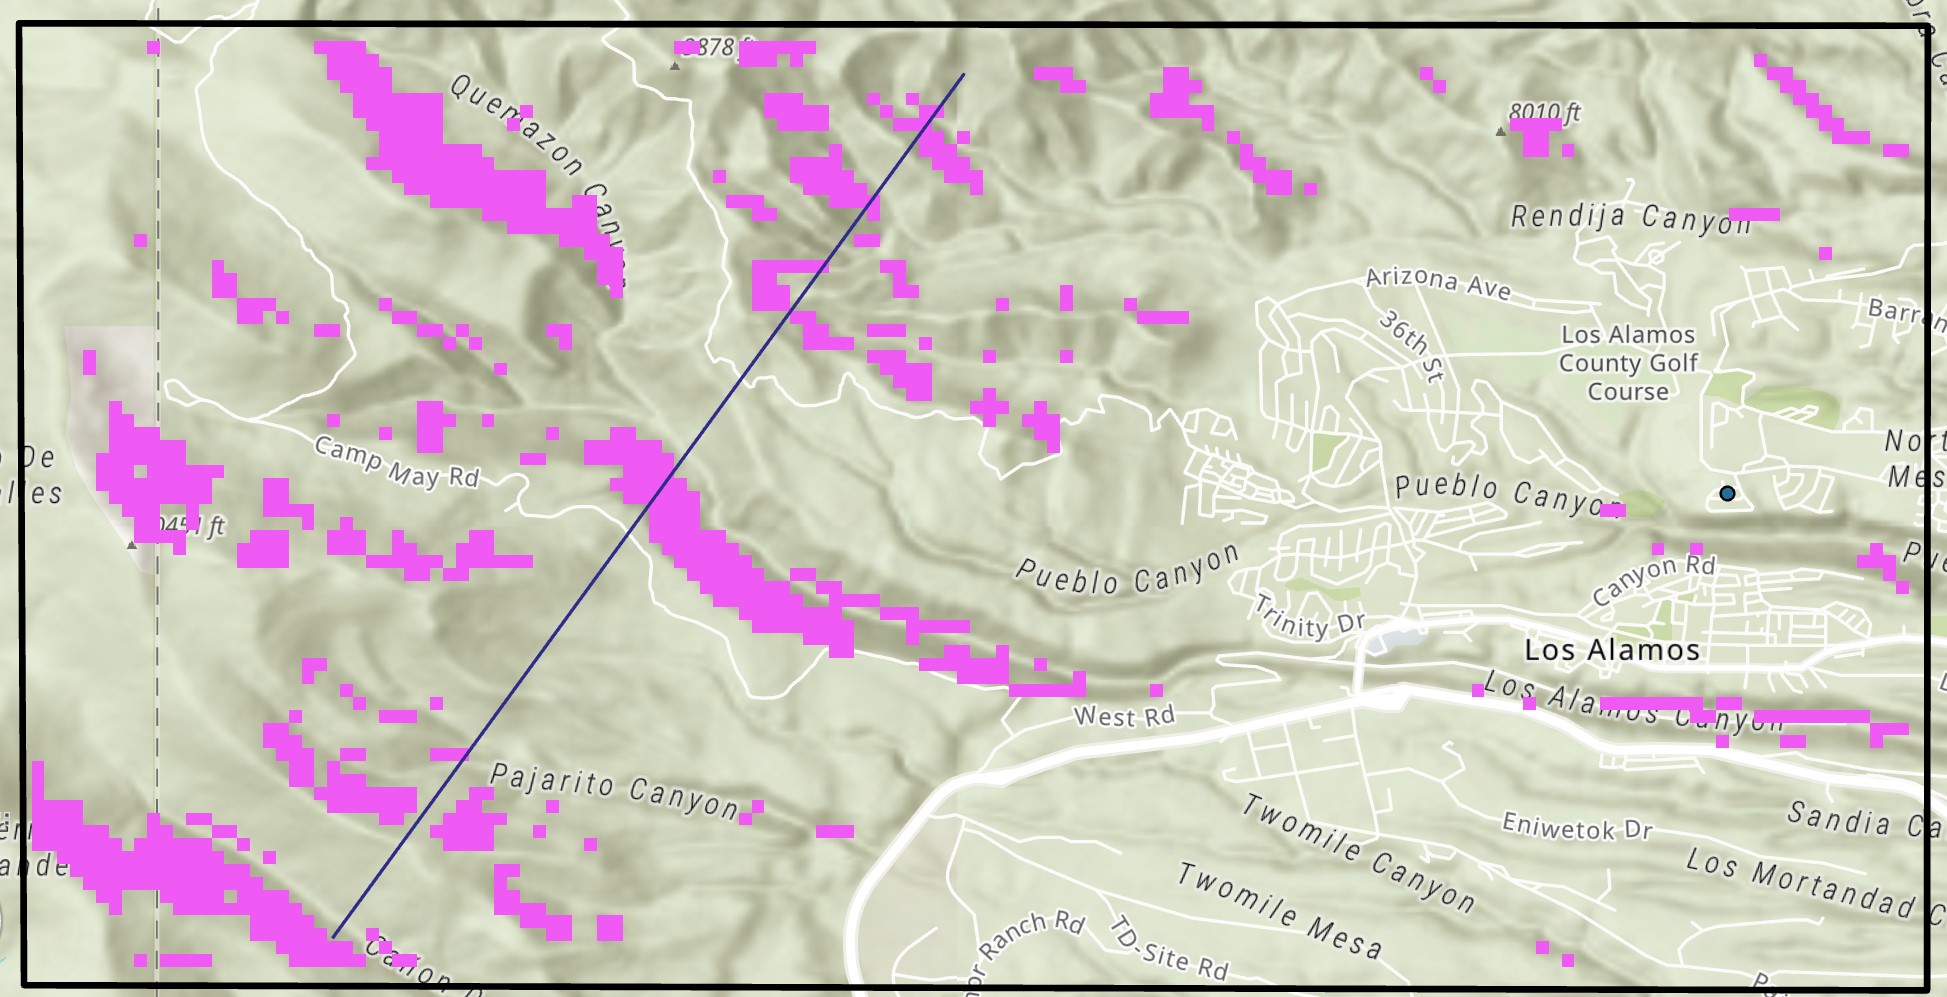
- Mark as New
- Bookmark
- Subscribe
- Mute
- Subscribe to RSS Feed
- Permalink
several ways, but Combine will give you some flexibility
It will produce the unique combinations of the inputs, and you can query the output accordingly
purple pink
1 1
1 nodata
nodata 1
nodata nodata
so you are interested in the first two classes from the resultant
... sort of retired...
- Mark as New
- Bookmark
- Subscribe
- Mute
- Subscribe to RSS Feed
- Permalink
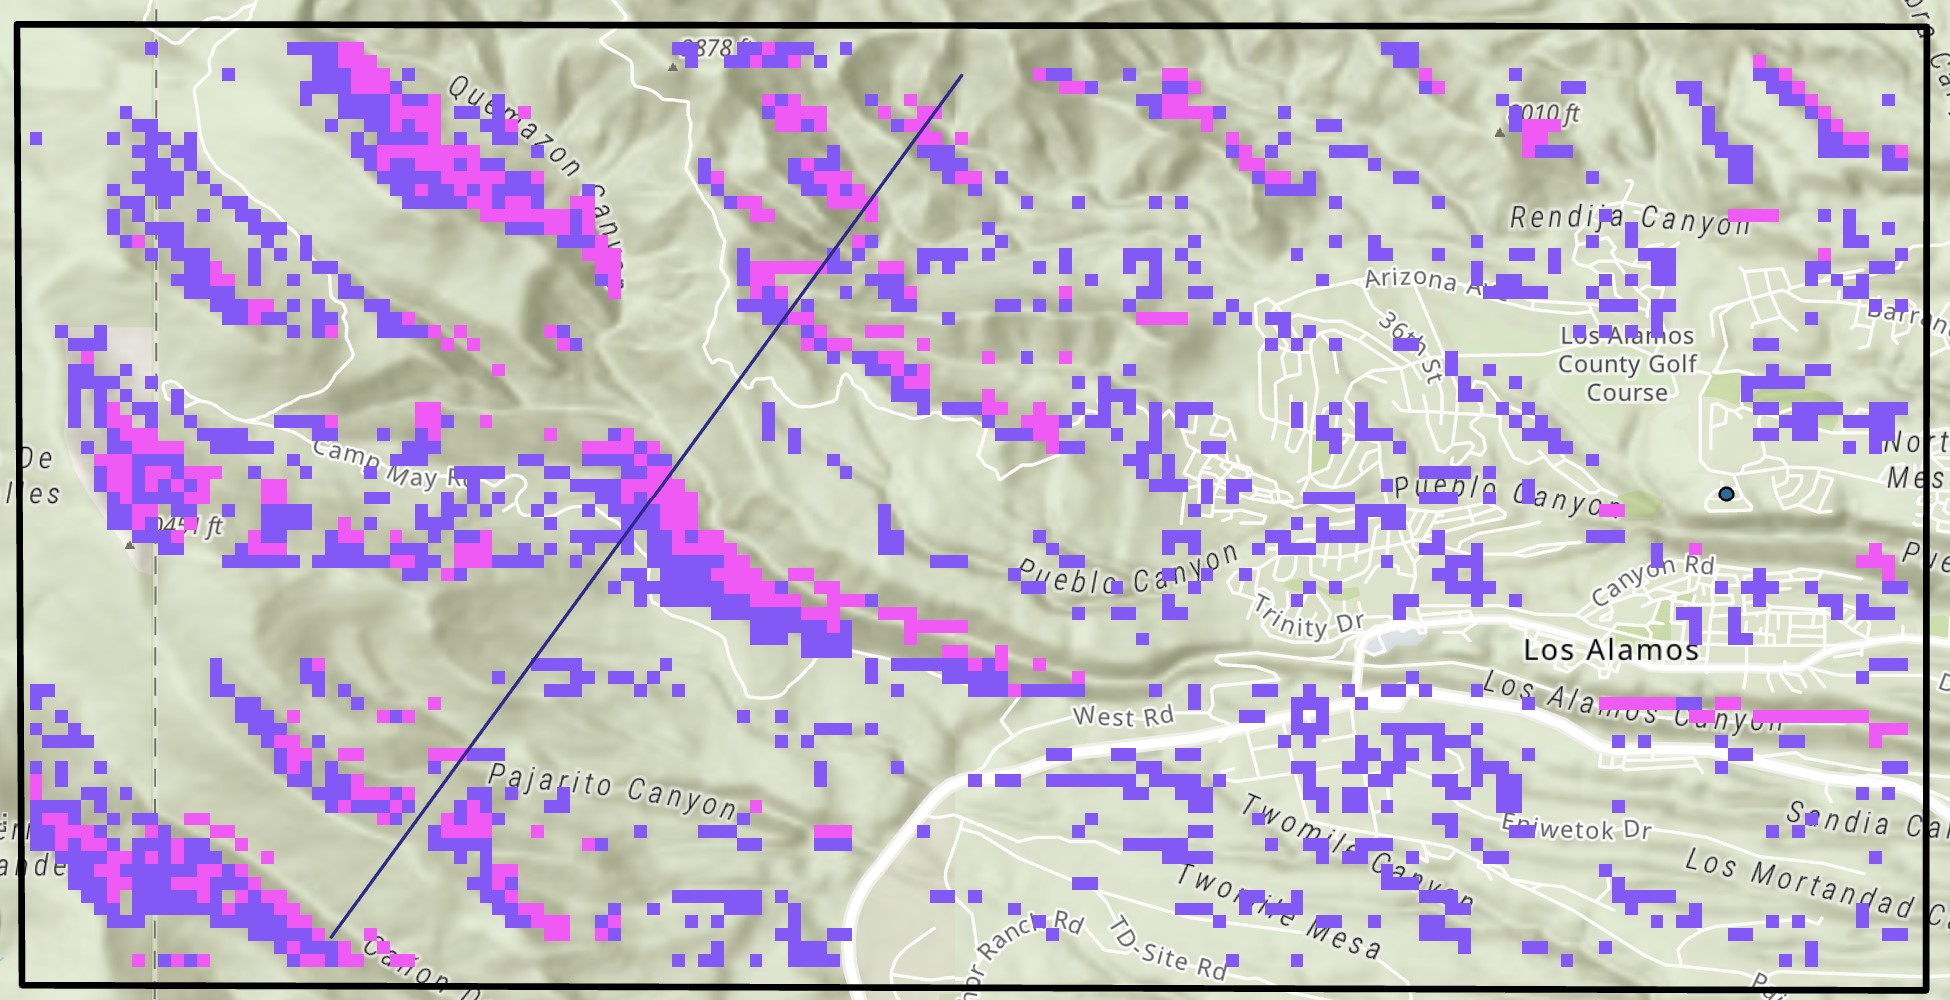
Thanks! Have used the combine tool (below), but how do I remove the values of '3' (which represent areas of light purple) that are isolated? i.e. are not next to a '2' or a '4'? (See pic below for example of areas to remove and keep)

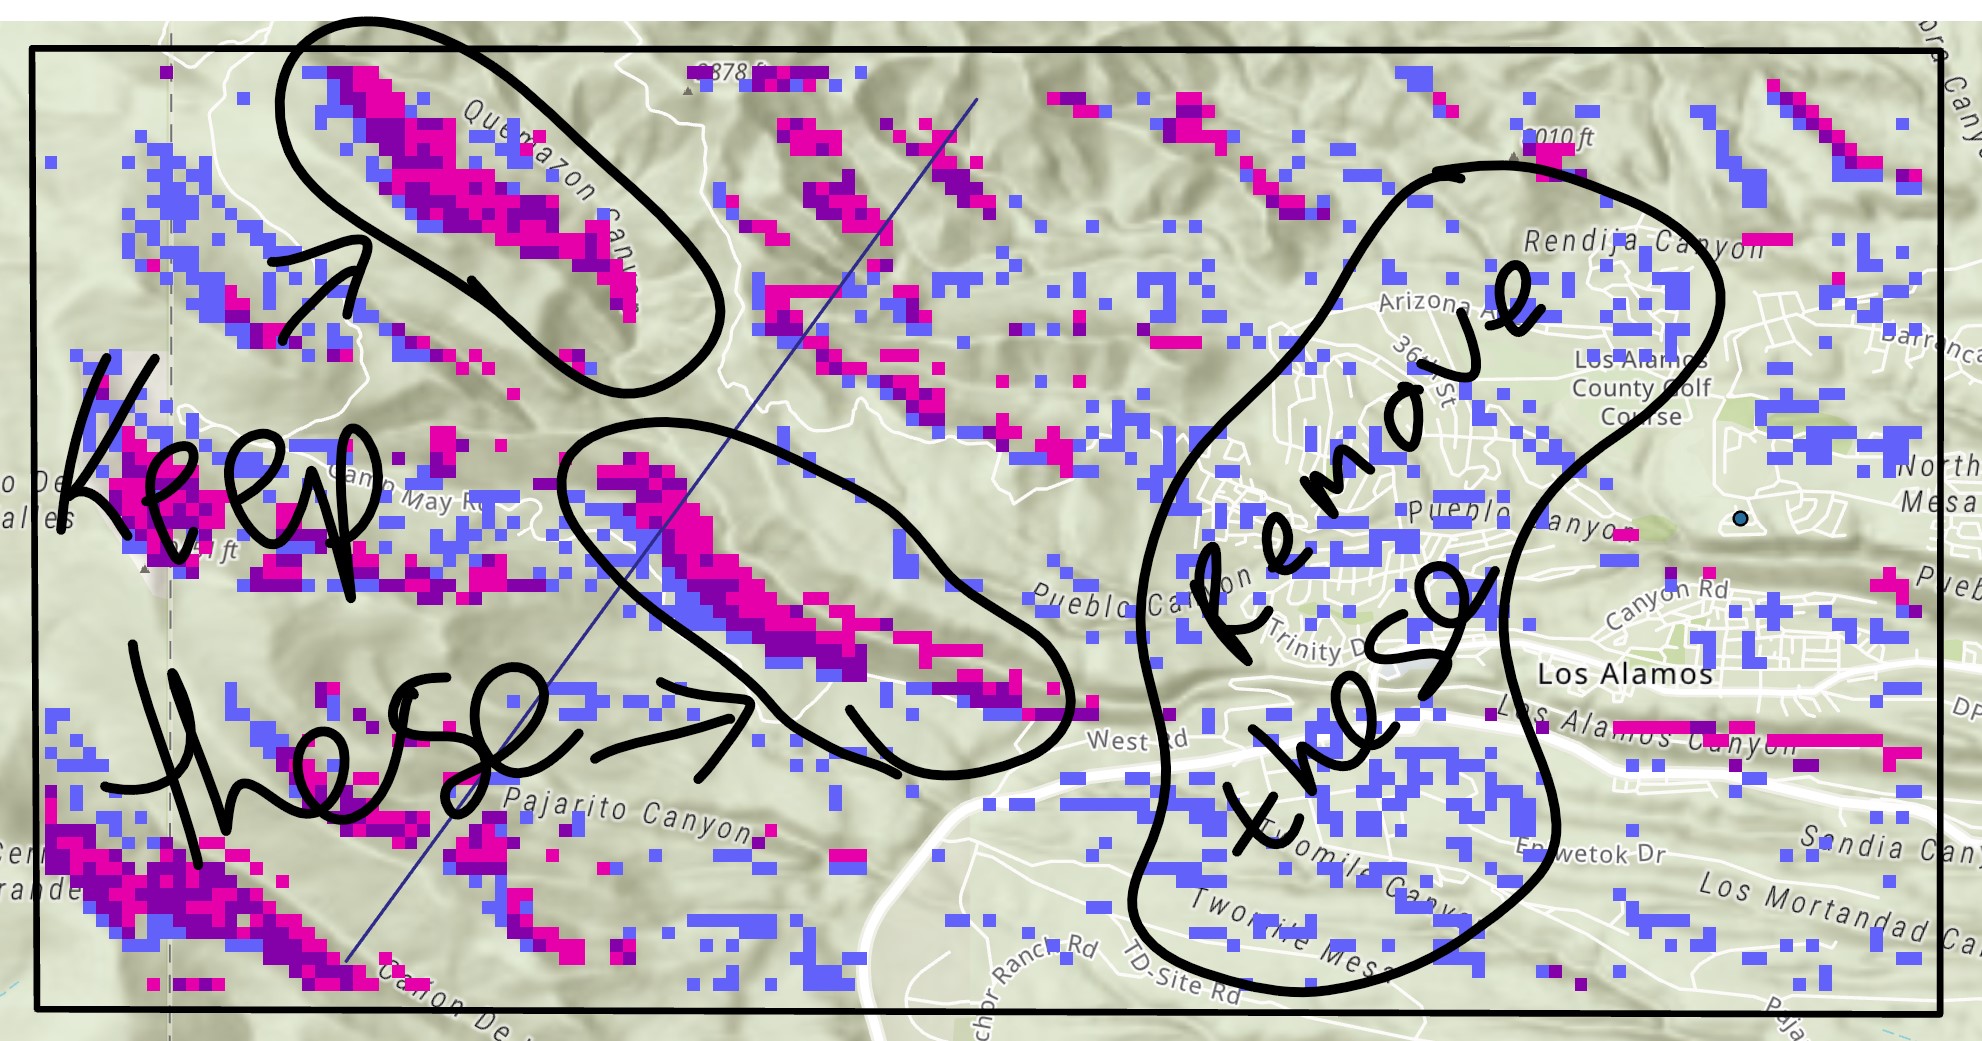
Thanks in advance!
- Mark as New
- Bookmark
- Subscribe
- Mute
- Subscribe to RSS Feed
- Permalink
Rachel ... when you mean 'adjacent' to you mean within 1 cell? 2 cells? adjecent-ish?
In that case I would use the Expand tool on the 'pink' and effectively buffer them, then use combine as before except exclude those cases that are denoted as 1, nodata from above.
I think you will have corner cases in any event.
Addendum
I would also have a look at the Generalization toolset to prepare input rasters first.
Some combination of the tools in there and a combine (perhaps) might get you close
How Aggregate works—Help | Documentation
Boundary Clean—Help | Documentation did you look at this?
Majority Filter—Help | Documentation did you try it?
How about a focal variety? Focal Statistics—Help | Documentation
The list goes on, some things working in some areas and not in others
... sort of retired...
- Mark as New
- Bookmark
- Subscribe
- Mute
- Subscribe to RSS Feed
- Permalink
Brought up an old thread perhaps closely related
... sort of retired...
- Mark as New
- Bookmark
- Subscribe
- Mute
- Subscribe to RSS Feed
- Permalink
Not a dumb question, this is a tricky raster processing puzzle. Fortunately, the Raster Calculator makes it fairly easy to combine tools to get your answer. Map Algebra is cool.
A key part of this is the use of the Con (conditional) tool to make choices about what cell values you want. Note I'm assuming the cells you don't want are zero (not NoData), this is based on your second screen shot.
1. Make a mask of combined grids where purple==1 and pink==2. Where pink and purple cells overlap, you get a value of 1, if neither are >0, NoData.
If using raster calculator tool, make the output cgroup and start the expression AFTER the = sign.
cgroup = Con("pink.tif" == 1, 1, Con("blue.tif" == 1, 2))2. Convert all data cells to 1 (cgroup > 0 creates a grid that has values of 1 and nodata).
Make zones (unique cell value) for each continuous group of "data" cells
mgroup = RegionGroup(cgroup > 0)3. Select all cells that are in a grouped region (zone) with more than one of the two cgroup values, extract cgroup values from those zones.
Pick one of the following depending on what you want the output to look like.
mgroupv = Con(ZonalStatistics(mgroup, "VALUE", cgroup, "VARIETY") > 1, 1)The above returns cells with values of 1 and NoData. You can use Con one last time to convert your NoData to zero if you want (like your input rasters)
mgroupv0 = Con(IsNull(mgroupv), 0, mgroupv)