- Home
- :
- All Communities
- :
- Products
- :
- ArcGIS Spatial Analyst
- :
- ArcGIS Spatial Analyst Questions
- :
- Re: How to categorize a raster based on pixel coun...
- Subscribe to RSS Feed
- Mark Topic as New
- Mark Topic as Read
- Float this Topic for Current User
- Bookmark
- Subscribe
- Mute
- Printer Friendly Page
How to categorize a raster based on pixel count within a moving kernel?
- Mark as New
- Bookmark
- Subscribe
- Mute
- Subscribe to RSS Feed
- Permalink
I have a classified raster with four land cover classes - built-up, vegetation, water and barren land.
Now, I want to categorize the built-up areas into three more classes - high built-up density, medium built-density and low built-up density.
I have reclassified my raster into two classes - built-up is 1 and vegetation, water and barren land has been merged into a single class 0.
For categorizing the built-up I am considering a moving circular neighborhood with a radius of 150 meters. My raster has a spatial resolution of 30 meters. As the kernel (neighborhood) moves, the central pixel is assigned a category every time.
And, the conditions for categorization are: high density if more than 50% of pixels within the neighborhood are built-up (class value = 2), medium density if 25 - 50% of pixels within the neighborhood are built-up (class value = 3) and low density if less than 25% pixels within the neighborhood are built-up (class value = 4).
I have been trying to use the model builder and the CON expression from the raster calculator. But have failed to get the desired output.
Please help if anybody has any idea as to how can this problem be solved!
- Mark as New
- Bookmark
- Subscribe
- Mute
- Subscribe to RSS Feed
- Permalink
Focal Statistics ....
Since you have 0 and 1 in your raster I would suggest using a focal sum since nothing is going to return percentage.
You will just need to know how many cells constitute your 150 m circular neighborhood with your 30m cell size.
Do a count. 150 at 30 for a rectangular neighborhood would be 5x5 = 25 cells... a circle will have slightly less.
For example
- sum is 13 or greater, then you have >50% so class 2 (ie 12.5/25)
- sum is 6 -12 , then you have 25-50% so class 3
- sum < 6 then class 4.
So get the sums from your binary raster (0's and 1's)
Reclass the sums raster, leaving 0 as 0
No need for Con
- Mark as New
- Bookmark
- Subscribe
- Mute
- Subscribe to RSS Feed
- Permalink
Dan,
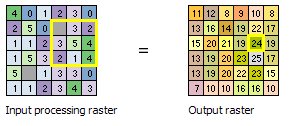
I thought of doing this as well. But there may be a problem. I think cells closer to the edge of the raster may be summed based on fewer cells than cells in the middle. The sample image in the ArcGIS Desktop help indicates that this may be the case (see image below). For example, notice the '11' at the upper left of the Output Raster. That's summed using only four cells (since it is at the edge of the raster). Compare this to the '24' that is outlined in yellow in the Output Raster. This is summed using nine cells. I am using a circular analysis shape as well. I'm interested to hear what you think. I sure could be wrong on this.
- Mark as New
- Bookmark
- Subscribe
- Mute
- Subscribe to RSS Feed
- Permalink
edges are treated differently since they can't had a 9 cell window. Which is why it is important to use an extent larger than you critically need and the data are available
The edge treatment is correct given the window limitations along the edges and the corners.
- Mark as New
- Bookmark
- Subscribe
- Mute
- Subscribe to RSS Feed
- Permalink
> I would suggest using a focal sum since nothing is going to return percentage
There is a neat trick for this. FocalStatistics with MEAN on a Boolean (0-1) raster, with the results then multiplied by 100, gives you percentage in the window. This will also handle the edges better (although of course the number of cells is less so you could see some artifacts as some cells in your neighborhood are NoData when you get to the edge. (If you want to suppress those partial values from being calculated you can use the DATA|NODATA flag in Focal Statistics, then the edge neighborhood cells will be set to NoData.)
You can do this inside Raster Calculator:
100 * FocalStatistics("inraster", NbrCircle(150,"MAP"),"MEAN")> the conditions for categorization are: high density if more than 50% of pixels within the neighborhood are built-up (class value = 2), medium density if 25 - 50% of pixels within the neighborhood are built-up (class value = 3) and low density if less than 25% pixels within the neighborhood are built-up (class value = 4).
You can use Reclassify, or my favorite, Con:
Con("pct" >= 50, 2, Con("pct" >=25, 3, 4)))If you want to reclassify 0 to 0 as Dan suggests, add one more:
Con("pct" >= 50, 2, Con("pct" >=25, 3, Con("pct" > 0, 4, 0))))