- Home
- :
- All Communities
- :
- Products
- :
- ArcGIS Spatial Analyst
- :
- ArcGIS Spatial Analyst Questions
- :
- How do I run a regression on NDVI raster values?
- Subscribe to RSS Feed
- Mark Topic as New
- Mark Topic as Read
- Float this Topic for Current User
- Bookmark
- Subscribe
- Mute
- Printer Friendly Page
How do I run a regression on NDVI raster values?
- Mark as New
- Bookmark
- Subscribe
- Mute
- Subscribe to RSS Feed
- Permalink
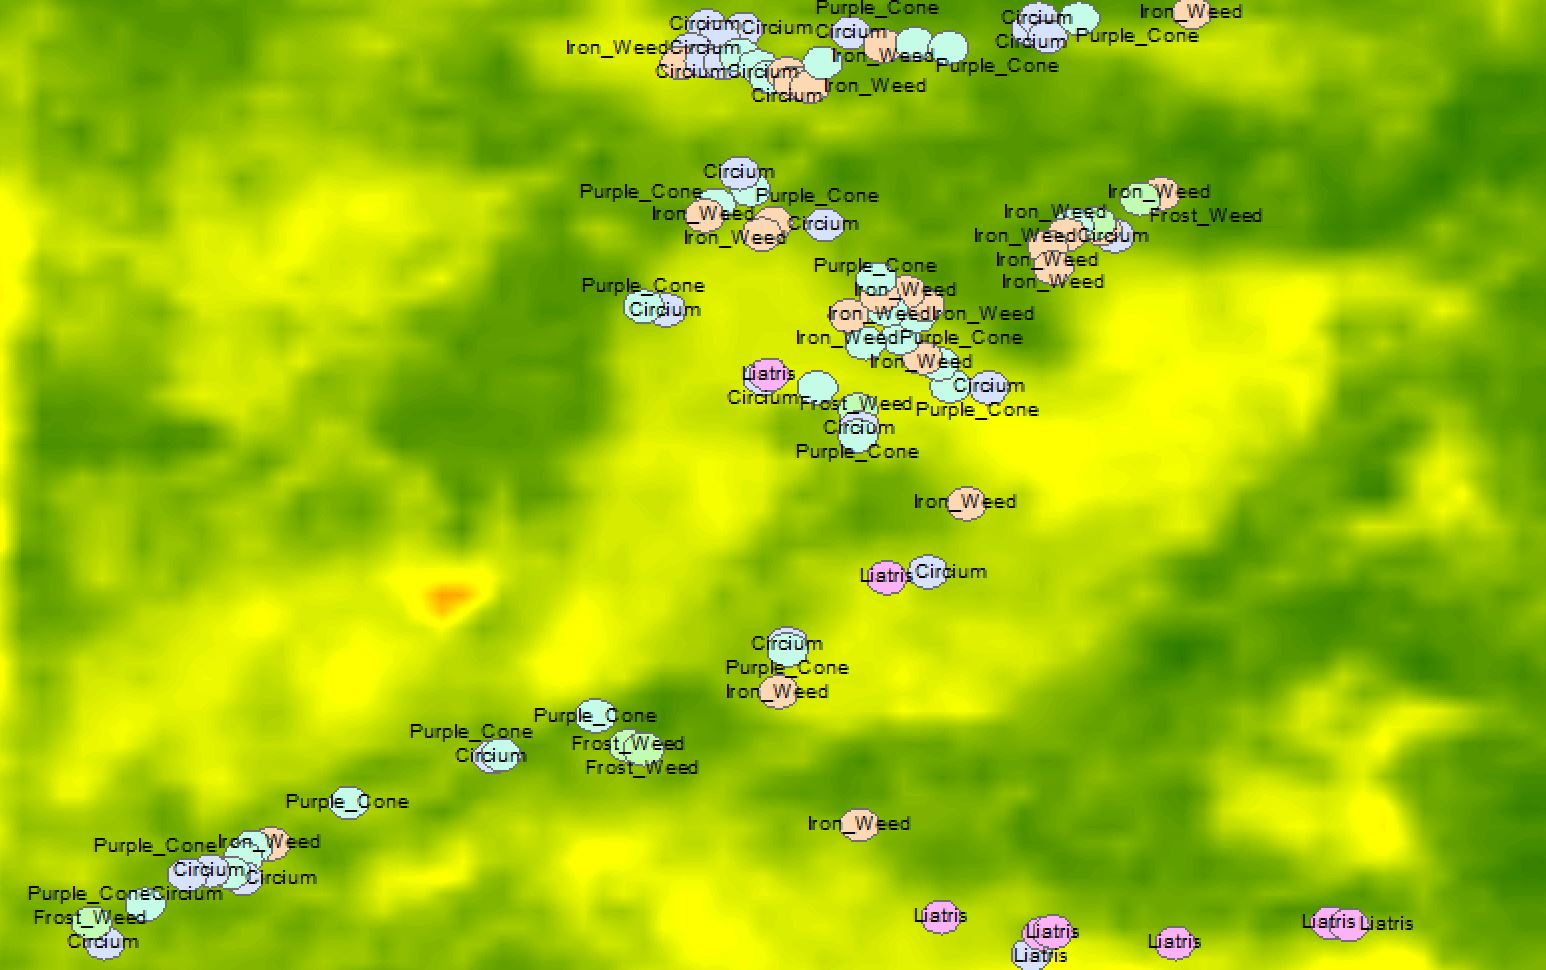
Hello, I'm trying to wrap my head around a raster analysis concept. I have an NDVI map of my study area. On this map, I have point features for which I have created a small buffer around them, therefor creating a set of round polygons on the map that I use to measure NDVI values within. Each of these points or buffer areas corresponds to a different plant species. I have ran the zonal statistics to get the average NDVI means of each buffer area so I can get a rough idea of the mean NDVI values for which the species can be found. I now want to know if there is a statistically significant difference between the mean NDVI values of the plant species, i.e. are the values significantly different? I want to know if arcgis can give me p-values so I can reject or accept the null hypothesis (0.05 confidence) (species A has a different mean NDVI value than B, Species A has the same NDVI mean as species D, etc.)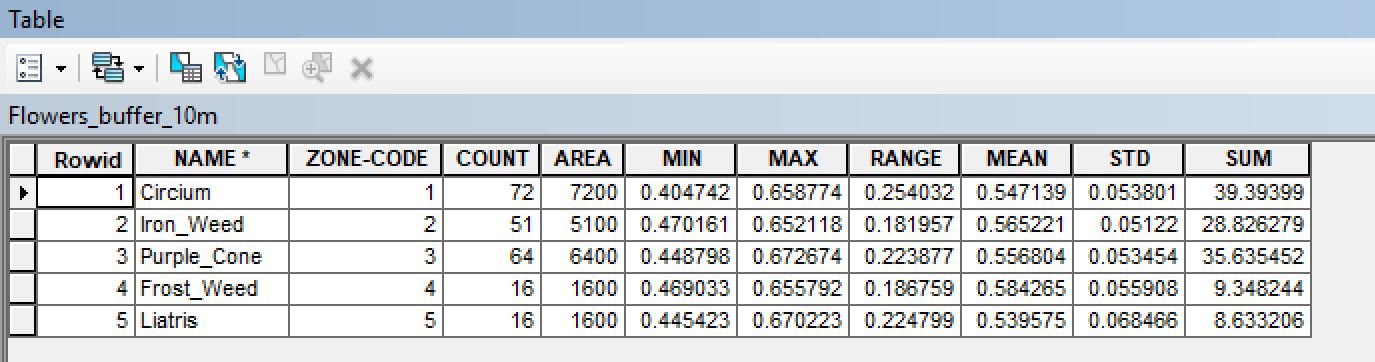
- Mark as New
- Bookmark
- Subscribe
- Mute
- Subscribe to RSS Feed
- Permalink
Not what you are asking... however, when you do a zonal statistics using overlapping zones, you will get unwanted results since the zones will be converted to raster and overlapping areas will probably be assigned to the last overlapping feature. Just a comment to take into account when interpreting the results.
- Mark as New
- Bookmark
- Subscribe
- Mute
- Subscribe to RSS Feed
- Permalink
Is there a way to avoid this? These areas are very small 10 m so I do expect some buffer areas to have close if not the same NDVI value, but if they overlap and are located within a high NDVI zone and a low NDVI zone (like near a forest edge), I wouldn't want them to have the same mean because they shouldn't. Does the software not measure each polygon individually?
- Mark as New
- Bookmark
- Subscribe
- Mute
- Subscribe to RSS Feed
- Permalink
As mentioned before; ArcGIS will convert the zones to raster and a pixel can only hold a single value. However, there is an (old) solution provided at the support site: How To: Calculate Zonal Statistics for Overlapping Zones
- Mark as New
- Bookmark
- Subscribe
- Mute
- Subscribe to RSS Feed
- Permalink
I now want to know if there is a statistically significant difference between the mean NDVI values of the plant species, i.e. are the values significantly different? I want to know if arcgis can give me p-values so I can reject or accept the null hypothesis (0.05 confidence)
ArcGIS is not really the best place to answer this question, a stat package like R would be better. Python and Excel can do this, but you'd get minimal statistical diagnostics compared to a stat package like R.
Student's T Test requires that the parameters for each subject are independent -- they are not if the points have overlapping buffers, or if there is spatial autocorrelation at play (there usually is).