- Home
- :
- All Communities
- :
- Products
- :
- ArcGIS Spatial Analyst
- :
- ArcGIS Spatial Analyst Questions
- :
- How do I calculate a field using data from Excel
- Subscribe to RSS Feed
- Mark Topic as New
- Mark Topic as Read
- Float this Topic for Current User
- Bookmark
- Subscribe
- Mute
- Printer Friendly Page
How do I calculate a field using data from Excel
- Mark as New
- Bookmark
- Subscribe
- Mute
- Subscribe to RSS Feed
- Permalink
Ran Ordinary Least Squares and the output table is in Excel. I am using the data from the 5 variables to predict the value in another data set with the same variables. I was hoping to have a calculated field where I could multiply the coefficient times the whole column for all 5 variables. Coefficient 1 times Variable 1, Coefficient 2 times variable 2, etc. Does anyone have any experience doing this?
- Mark as New
- Bookmark
- Subscribe
- Mute
- Subscribe to RSS Feed
- Permalink
You could add the xls as a gdb table then use search and update cursors to do the calculations.
- Mark as New
- Bookmark
- Subscribe
- Mute
- Subscribe to RSS Feed
- Permalink
Thank you. I am not well steeped in Python.
- Mark as New
- Bookmark
- Subscribe
- Mute
- Subscribe to RSS Feed
- Permalink
If you send some pictures of the tables and a comprehensive explanation of what you want to achieve, I can write it out.
- Mark as New
- Bookmark
- Subscribe
- Mute
- Subscribe to RSS Feed
- Permalink

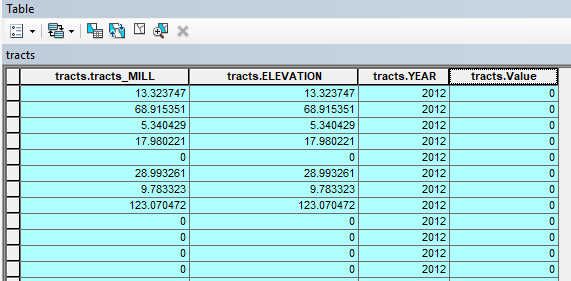
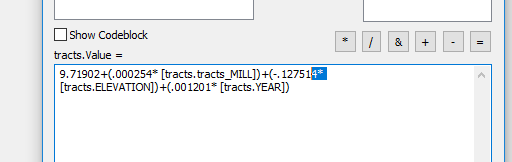
I am trying to calculate the tracts.Value field by using the below equation. I can do it once but, as soon as I run a different regression, I have to change all of the coefficients for each Variable. Furthermore, I have 20+ variables to use and, therefore, the number of variables can fluctuate.
- Mark as New
- Bookmark
- Subscribe
- Mute
- Subscribe to RSS Feed
- Permalink
I'm sorry it's easily codeable but I still don't get the whole picture.
- Mark as New
- Bookmark
- Subscribe
- Mute
- Subscribe to RSS Feed
- Permalink
When I run the Ordinary Least Squares tool the result is a regression that is reported in OLS_Coefficients. The regression is based on home sales with a known sales price. I am trying to take the Coefficient of each variable and apply it to homes that we don't have sales data on. We have the same Variable but just don't know the price.
- Mark as New
- Bookmark
- Subscribe
- Mute
- Subscribe to RSS Feed
- Permalink
So theres an OLS table for each row in the table in the second image?
- Mark as New
- Bookmark
- Subscribe
- Mute
- Subscribe to RSS Feed
- Permalink
There is one OLS table for the whole "tracts" table. It is a one-to-many relationship.
- Mark as New
- Bookmark
- Subscribe
- Mute
- Subscribe to RSS Feed
- Permalink
Are you saying you have multiple tables such as tracts and an ols table for each of them?