Turn on suggestions
Auto-suggest helps you quickly narrow down your search results by suggesting possible matches as you type.
Cancel
- Home
- :
- All Communities
- :
- Products
- :
- ArcGIS Spatial Analyst
- :
- ArcGIS Spatial Analyst Questions
- :
- Re: Hillshade and Slope Calculation Problem
Options
- Subscribe to RSS Feed
- Mark Topic as New
- Mark Topic as Read
- Float this Topic for Current User
- Bookmark
- Subscribe
- Mute
- Printer Friendly Page
10-29-2010
10:10 PM
- Mark as New
- Bookmark
- Subscribe
- Mute
- Subscribe to RSS Feed
- Permalink
- Report Inappropriate Content
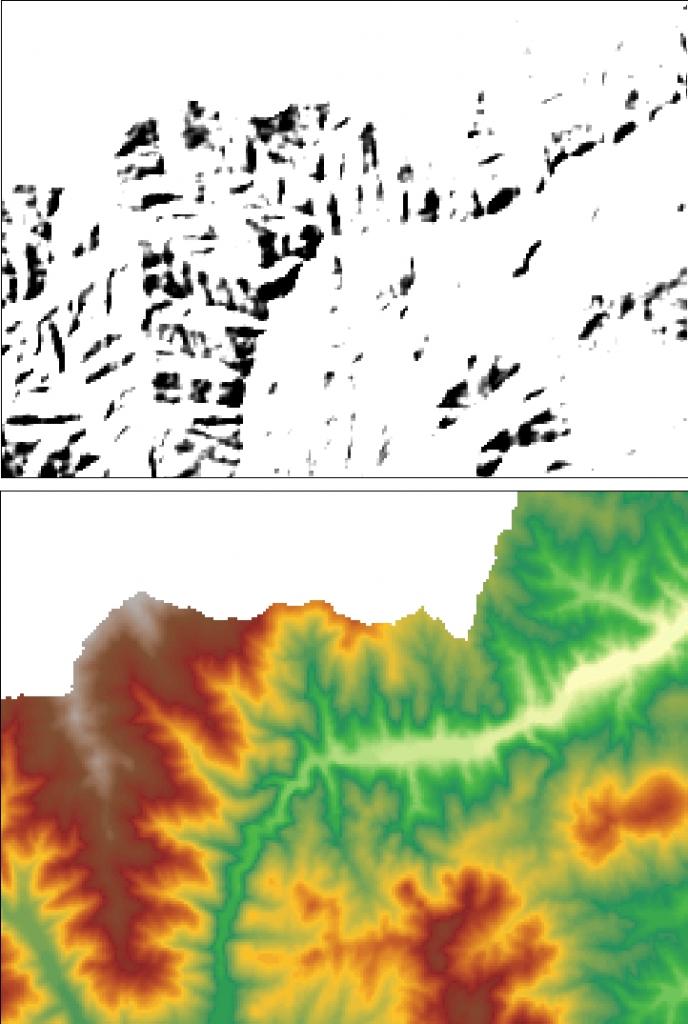
When I calculate slope and hillshade from a dem the results I get look weird... like gridlines. In the case of slope it looks like it is calculating the centre of each cell as flat (zero slope) and making the boundaries between slopes relatively steep. With hillshade the cell centres have a high value and the boundaries between cells relatively low values (see attchments). I'm currently using ArcView 9.3 sp1. I was thinking there might be something wrong with the DEM - but when I tried redoing slope and hillshade for a dem that I had successfully dones these for back in early 2009 I got the same problem.
If anyone out there has had this problem and can shed some light on how to fix it I would be very grateful.
If anyone out there has had this problem and can shed some light on how to fix it I would be very grateful.
Solved! Go to Solution.
1 Solution
Accepted Solutions
by
Anonymous User
Not applicable
11-01-2010
02:42 PM
- Mark as New
- Bookmark
- Subscribe
- Mute
- Subscribe to RSS Feed
- Permalink
- Report Inappropriate Content
Original User: debbow73
I figured out how to fix this... in the Hillshade tool go into Environments > Raster Analysis Settings, and set the cell size to Same As the DEM (I thought I had done this on the Spatial Analyst Toolbar > Options -- but I guess these two processes do different things!?!?). Anyway - I now have a perfect slope raster :D.
Hillshade still looks a bit weird (see attachment) - very "white" compared to hillshades I have made before. Values in the Hillshade range from 37(black) - 127(white). Was wondering if the problem is in how I'm displaying it... but I can't figure out how to make 0 black and 255 white. I'll keep working on it! 😮
10 Replies
10-31-2010
11:03 AM
- Mark as New
- Bookmark
- Subscribe
- Mute
- Subscribe to RSS Feed
- Permalink
- Report Inappropriate Content
is the map projected? (ie UTM, state plane?)
are the x, y units the same as the Z values? (ie meters, feet)
are the x, y units the same as the Z values? (ie meters, feet)
by
Anonymous User
Not applicable
10-31-2010
12:00 PM
- Mark as New
- Bookmark
- Subscribe
- Mute
- Subscribe to RSS Feed
- Permalink
- Report Inappropriate Content
Original User: debbow73
Projection is WGS_1984_UTM_Zone_34N, and x, y and z are all in metres.
Projection is WGS_1984_UTM_Zone_34N, and x, y and z are all in metres.
11-01-2010
08:03 AM
- Mark as New
- Bookmark
- Subscribe
- Mute
- Subscribe to RSS Feed
- Permalink
- Report Inappropriate Content
hey,
ive got the same problem at the moment.....is there a solution, yet?
ive got the same problem at the moment.....is there a solution, yet?
by
Anonymous User
Not applicable
11-01-2010
02:42 PM
- Mark as New
- Bookmark
- Subscribe
- Mute
- Subscribe to RSS Feed
- Permalink
- Report Inappropriate Content
Original User: debbow73
I figured out how to fix this... in the Hillshade tool go into Environments > Raster Analysis Settings, and set the cell size to Same As the DEM (I thought I had done this on the Spatial Analyst Toolbar > Options -- but I guess these two processes do different things!?!?). Anyway - I now have a perfect slope raster :D.
Hillshade still looks a bit weird (see attachment) - very "white" compared to hillshades I have made before. Values in the Hillshade range from 37(black) - 127(white). Was wondering if the problem is in how I'm displaying it... but I can't figure out how to make 0 black and 255 white. I'll keep working on it! 😮
I figured out how to fix this... in the Hillshade tool go into Environments > Raster Analysis Settings, and set the cell size to Same As the DEM (I thought I had done this on the Spatial Analyst Toolbar > Options -- but I guess these two processes do different things!?!?). Anyway - I now have a perfect slope raster :D.
Hillshade still looks a bit weird (see attachment) - very "white" compared to hillshades I have made before. Values in the Hillshade range from 37(black) - 127(white). Was wondering if the problem is in how I'm displaying it... but I can't figure out how to make 0 black and 255 white. I'll keep working on it! 😮
11-01-2010
02:47 PM
- Mark as New
- Bookmark
- Subscribe
- Mute
- Subscribe to RSS Feed
- Permalink
- Report Inappropriate Content
check this blog and see if it applies to your situation
http://blogs.esri.com/dev/blogs/imagery/archive/2010/09/07/why-does-my-hillshade-look-different-when...
http://blogs.esri.com/dev/blogs/imagery/archive/2010/09/07/why-does-my-hillshade-look-different-when...
by
Anonymous User
Not applicable
11-01-2010
03:13 PM
- Mark as New
- Bookmark
- Subscribe
- Mute
- Subscribe to RSS Feed
- Permalink
- Report Inappropriate Content
Original User: debbow73
😮 Lowering the altitude in the Hillshade Tool seems to have done the trick 😄
😮 Lowering the altitude in the Hillshade Tool seems to have done the trick 😄
11-02-2010
06:44 AM
- Mark as New
- Bookmark
- Subscribe
- Mute
- Subscribe to RSS Feed
- Permalink
- Report Inappropriate Content
Hm.....in my case it still doesn't work. Any other idea to solute this?
by
Anonymous User
Not applicable
11-02-2010
10:27 AM
- Mark as New
- Bookmark
- Subscribe
- Mute
- Subscribe to RSS Feed
- Permalink
- Report Inappropriate Content
Original User: whuber
Those are artifacts introduced during the construction or processing of the DEM. They are really in the data, not a bug in the hillshade or slope calculations.
You have two strategies for dealing with this issue:
(1) Accept your data and attempt to "fix" them. This requires preliminary smoothing (such as a focal mean) followed by recalculation of the hillshade and slope. Unfortunately, you will need strong smoothing and the result will depart appreciably from correct values. When you're hillshading to display the DEM, that can be ok, but otherwise it might not be.
(2) Find out where in the processing pipeline the errors occurred, go back before then, and redo the processing. These artifacts can appear as the result of converting floats to integer values at some stage; from changing cell sizes; as artifacts of lossy compression algorithms; and likely in other ways I have not yet encountered. This should be the preferred solution unless it's simply impossible (e.g., you obtained the DEM in this form originally and cannot obtain a better version from any other source).
When I calculate slope and hillshade from a dem the results I get look weird... like gridlines.
Those are artifacts introduced during the construction or processing of the DEM. They are really in the data, not a bug in the hillshade or slope calculations.
You have two strategies for dealing with this issue:
(1) Accept your data and attempt to "fix" them. This requires preliminary smoothing (such as a focal mean) followed by recalculation of the hillshade and slope. Unfortunately, you will need strong smoothing and the result will depart appreciably from correct values. When you're hillshading to display the DEM, that can be ok, but otherwise it might not be.
(2) Find out where in the processing pipeline the errors occurred, go back before then, and redo the processing. These artifacts can appear as the result of converting floats to integer values at some stage; from changing cell sizes; as artifacts of lossy compression algorithms; and likely in other ways I have not yet encountered. This should be the preferred solution unless it's simply impossible (e.g., you obtained the DEM in this form originally and cannot obtain a better version from any other source).
11-04-2010
08:41 AM
- Mark as New
- Bookmark
- Subscribe
- Mute
- Subscribe to RSS Feed
- Permalink
- Report Inappropriate Content