- Home
- :
- All Communities
- :
- Products
- :
- ArcGIS Spatial Analyst
- :
- ArcGIS Spatial Analyst Questions
- :
- Re: Find percentage of raster classes inside polyg...
- Subscribe to RSS Feed
- Mark Topic as New
- Mark Topic as Read
- Float this Topic for Current User
- Bookmark
- Subscribe
- Mute
- Printer Friendly Page
Find percentage of raster classes inside polygon
- Mark as New
- Bookmark
- Subscribe
- Mute
- Subscribe to RSS Feed
- Permalink
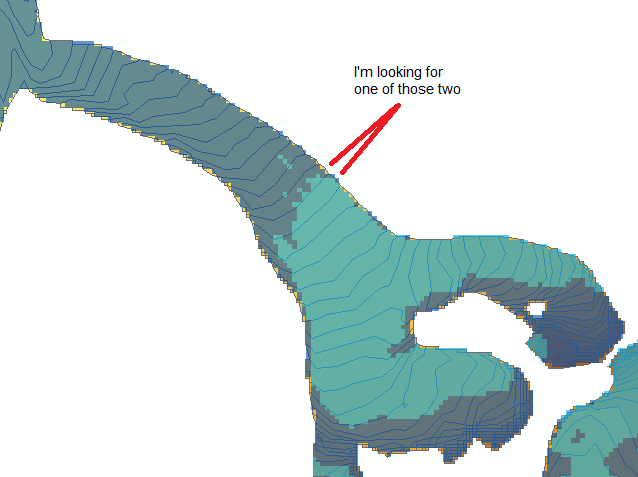
I have a raster representing glacierized area with 2 classes: distinction between ice and snow. I also have DEM of the area. I would like to calculate an average height of the boundary between those two classes. I came up with an idea I could somehow calculate how many pixels of each class belong to a given height range (like 500-515m a.s.l.). For example (with a picture):
- 100% of snow in this range isn't what I'm looking for (it's not a boundary)
- 100% of ice neither
- 80% of ice and 20% snow is not a boundary (could be a snow patch)
- 40% of snow and 60% of ice probably is a boundary (values are arbitrary and I'd like to evaluate them)
So I reclassified DEM to 15m intervals and vectorized it. And now I have no clue. The Zonal Statistics tool only allows me to calculate statistics like MIN, MAX, MAJ etc., whereas I need a percentage - a custom equation. Or maybe there is a different way?
- Mark as New
- Bookmark
- Subscribe
- Mute
- Subscribe to RSS Feed
- Permalink
One way is to convert the classified Raster to Polygon (non-simplified). Then, use Tabulate Intersection.
Think Location
- Mark as New
- Bookmark
- Subscribe
- Mute
- Subscribe to RSS Feed
- Permalink
Thank you, that made it. Afterwards I only had to select by attributes (where X/Y > Z) and do some Joins and Spatial Joins to get a clean attribute table with glacier name and the value. In my case, where more than one "ranges" were selected I also also summarized them by original FID, so I got an average of all selected boundaries (ranges).
- Mark as New
- Bookmark
- Subscribe
- Mute
- Subscribe to RSS Feed
- Permalink
This is a great answer.
Almost all of the zonal statistics related approaches to this problem seem overly complicated.
- Mark as New
- Bookmark
- Subscribe
- Mute
- Subscribe to RSS Feed
- Permalink
Totally not tried, but this percentage question keeps cropping up, but I think a .... zonal sum / zonal count .... would give you the necessary ratio, if snow were classed as 1
- zones - regiongroup your vectorized contour areas
- classify ice and snow data
- ice - class 0
- snow - class 1
- zonal area - is the Count column in the zonal statistics as table column
- zonal sum - is the sum column in the zonal statistics as table column, sum option
- do the math in a new field in the table, join back to the polygon zone