- Home
- :
- All Communities
- :
- Products
- :
- ArcGIS Spatial Analyst
- :
- ArcGIS Spatial Analyst Questions
- :
- Re: DEM - CONTOURS - FOCAL STATISTICS
- Subscribe to RSS Feed
- Mark Topic as New
- Mark Topic as Read
- Float this Topic for Current User
- Bookmark
- Subscribe
- Mute
- Printer Friendly Page
DEM - CONTOURS - FOCAL STATISTICS
- Mark as New
- Bookmark
- Subscribe
- Mute
- Subscribe to RSS Feed
- Permalink
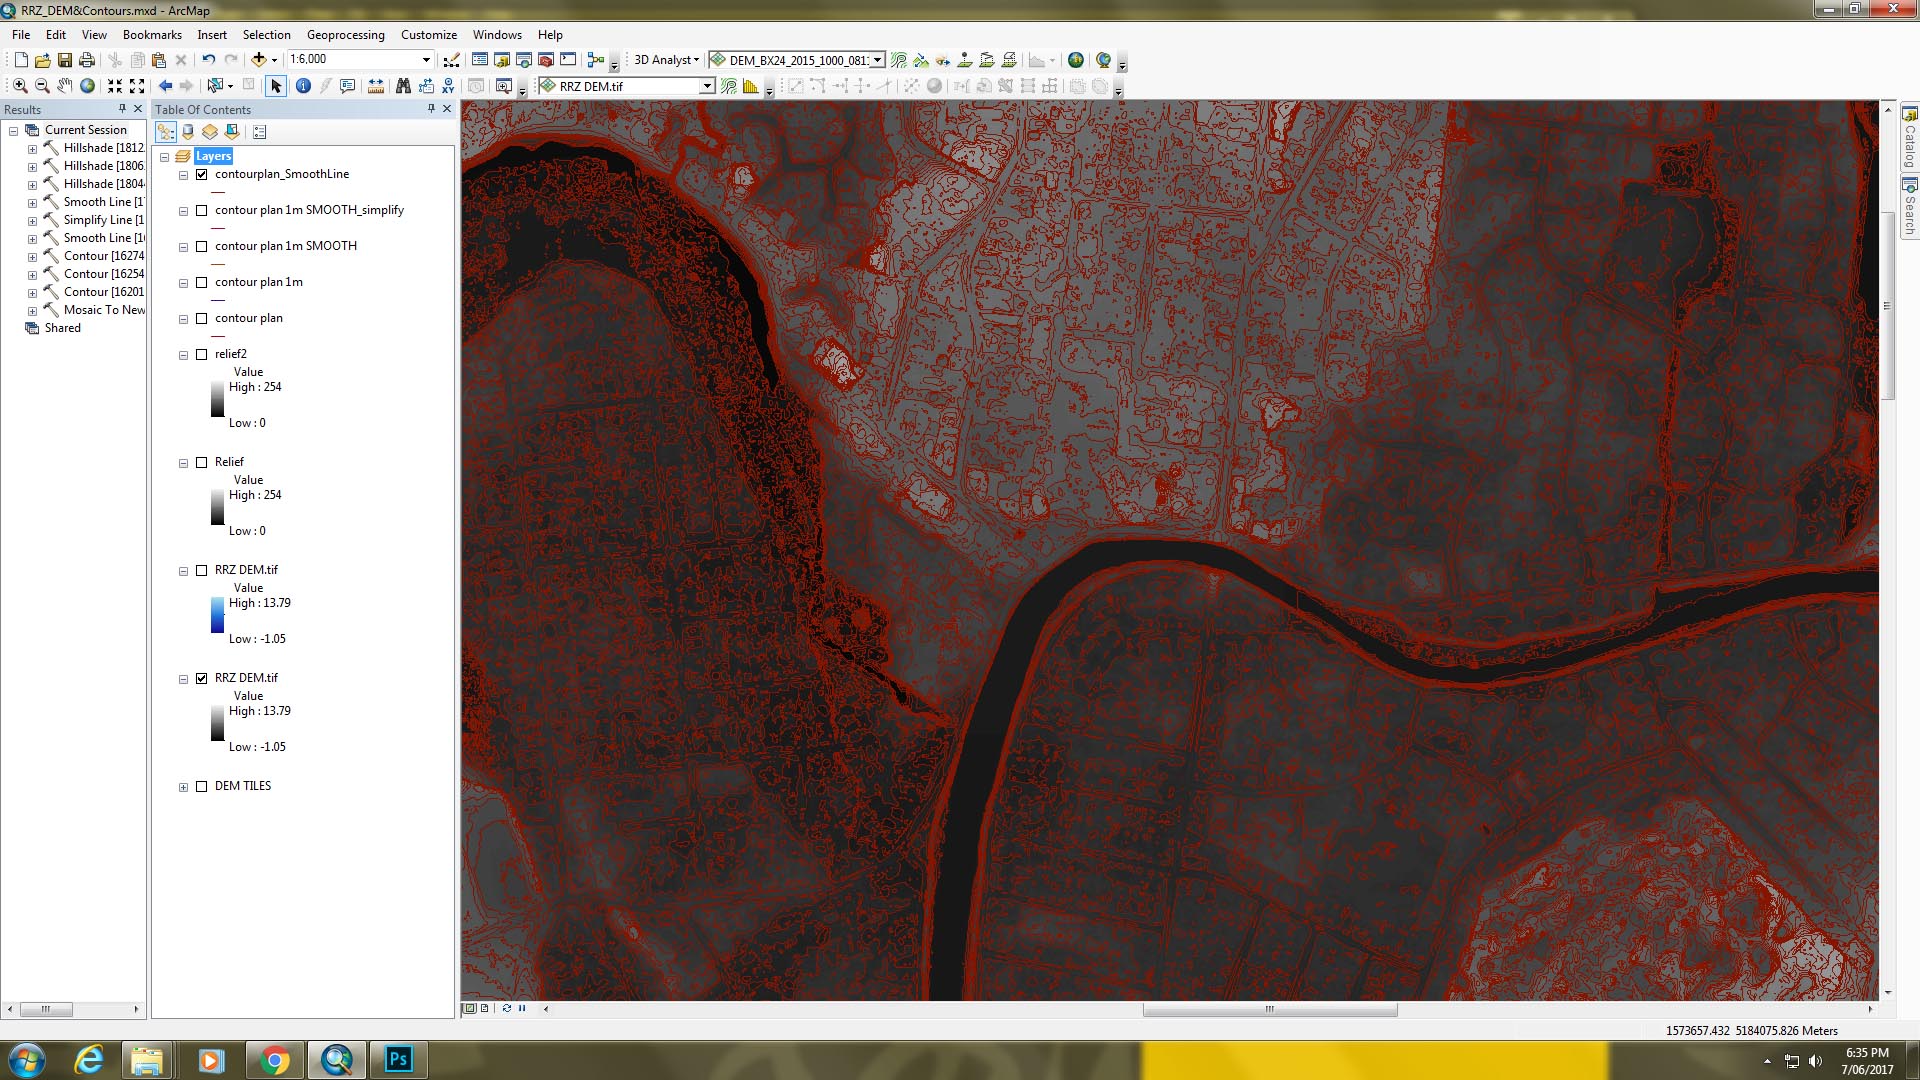
Hello All, I have generated a few different sets of contours (1m, 5m, .25m intervals) from a DEM I have of Christchurch city. With each interval tested above, the contours that result are very 'non cartographic'. I have tried simplifying & smoothing but would like a much more generalised outcome if possible. I also used the focal statistic operation on the DEM then generated contours from the outputted raster but the results were similar. Have I incorrectly used the focal statistic operation? Any suggestions / help appreciated! Thanks
- Mark as New
- Bookmark
- Subscribe
- Mute
- Subscribe to RSS Feed
- Permalink
Could you explain the "non-cartographic" nature of the contours?
What is the cell-size of the DEM?
In Focal Statistics, did you use the following parameters?
Statistics_Type = MEAN
Neighbourhood = 3X3.
Try using 5X5 or 7X7 for more smoother effect. But the cell values will become more diluted.
Think Location
- Mark as New
- Bookmark
- Subscribe
- Mute
- Subscribe to RSS Feed
- Permalink
In addition to the recommendations made by jayanta.poddar you could also apply Fill—Help | ArcGIS Desktop which may remove small circular contour lines caused by sinks in your DEM.
- Mark as New
- Bookmark
- Subscribe
- Mute
- Subscribe to RSS Feed
- Permalink
Hi Jayanta, Thanks for the reply. Ive jotted some answers to your Q below.
Could you explain the "non-cartographic" nature of the contours? I was hoping for contours that look like the attached screenshot of wellington city (image on the right). i.e not so many islands and odd shapes as in mine. Possible?
What is the cell-size of the DEM? 1,1
In Focal Statistics, did you use the following parameters?
Statistics_Type = MEAN. Yes
Neighbourhood = 3X3. Yes
Try using 5X5 or 7X7 for more smoother effect. But the cell values will become more diluted. The attached screen shot, (image on left) shows the outcome with the 7x7 = similar result.
I also tried the fill option and the result remains identical. Am i incorrectly doing the order of operations here? i.e With focal statistics I have been imputing the DEM then applying the contour operation to the new layer - focal statistic DEM.. if that makes sense.. Likewise with the fill - I used the DEM as the input raster then applied contours to the modified raster.
Thanks again!
Simon
- Mark as New
- Bookmark
- Subscribe
- Mute
- Subscribe to RSS Feed
- Permalink
Sorry here are attached screenshots. Thanks for your suggestion also Xander though it didnt seem to change the appearance.

- Mark as New
- Bookmark
- Subscribe
- Mute
- Subscribe to RSS Feed
- Permalink
your contour interval is too fine to produce any meaningful representation at the view scale. you might want to try a coarser interval (5, 10 m) as separate layers and assigning visibility through scale ranges.
- Mark as New
- Bookmark
- Subscribe
- Mute
- Subscribe to RSS Feed
- Permalink
Which neighborhood method is best used in this situation? Should I go with the default rectangle method and produce the contours out from the resulted raster ?