- Home
- :
- All Communities
- :
- Products
- :
- ArcGIS Spatial Analyst
- :
- ArcGIS Spatial Analyst Questions
- :
- Combining GRIDs
- Subscribe to RSS Feed
- Mark Topic as New
- Mark Topic as Read
- Float this Topic for Current User
- Bookmark
- Subscribe
- Mute
- Printer Friendly Page
- Mark as New
- Bookmark
- Subscribe
- Mute
- Subscribe to RSS Feed
- Permalink
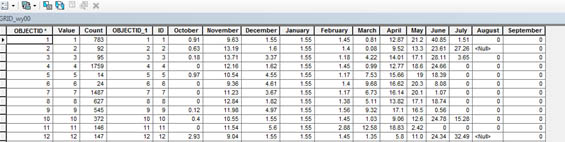
My brain is slowing down this Friday afternoon, and I am having trouble figuring this out. I have 42 GRIDs for a water basin (each representing a year). Each grid contains the attributes for January - December - so 12 attributes with the amount of water received for each month. Is there a way to create one final grid (or maybe one for each month) that contains the 42 year average of water for each month?? Any help or ideas is appreciated. This is what the attribute tables look like...
Solved! Go to Solution.
Accepted Solutions
- Mark as New
- Bookmark
- Subscribe
- Mute
- Subscribe to RSS Feed
- Permalink
This will only work is if the ObjectId value identifying each cell is identical across all tables, or there is some other common ID value field the preserves a common CELL ID across all 42 of your GRID tables. If the ObjectID is the only field that uniquely identifies each cell, then it must first be calculated into a Long field that will make its value permanent when you merge the tables. If the ObjectIDs are randomly assigned to any given cell across the tables, they you would first have to come up with a spatial method to assign each cell a specific unique value that is stable across all years and contained in every GRID table to perform any kind of summary by cell.
So first create a LONG field called CELL in every table and calculate the ObjectID of every table into it. Then merge all of the tables into one table. Then use the Summary Statistics tool and use the CELL field as the Unique Case field and each month field as a Summary field with the Mean summary type. All 78,000 cells will have their average created when the CELL field collapses to a single row for each CELL value with 12 columns of Means of the months of the year. This output summary table can then be joined back to the original 42 tables on the CELL field to compare each cell's actual annual month value to the corresponding 42 year mean (average) month column, if you wish to do that.
- Mark as New
- Bookmark
- Subscribe
- Mute
- Subscribe to RSS Feed
- Permalink
Use the Summary Statistics tool in the Analysis Toolbox -> Statistics toolset without any case field and add each month to the summary field list and use the Mean option. Optionally you can add each month multiple times to get the Min, Max, and Std Dev as well at the same time using this tool.
- Mark as New
- Bookmark
- Subscribe
- Mute
- Subscribe to RSS Feed
- Permalink
Thank you so much for your reply. Do you know if it is possible to get a 42 year average for each cell by month??
- Mark as New
- Bookmark
- Subscribe
- Mute
- Subscribe to RSS Feed
- Permalink
My instructions would give you the 42 year average by Month if this table has 42 rows (i.e., One row with 12 month column each giving the mean/average value of water for each month. Otherwise what field defines the Cell? If there is a field that has cell ID values then make that the Case Field in the Summary Statistics tool. But then how do you you know which year is which in this table? Are you sure you have correctly described what data this table contains? Beyond the month names none of the other column names mean anything without an explanation.
No matter what, the Summary Statistics tool is the tool that does what you are after since this is not a spatial feature class, just a table. If this was a Feature Class then the Dissolve tool would be better to do the summaries spatially.
- Mark as New
- Bookmark
- Subscribe
- Mute
- Subscribe to RSS Feed
- Permalink
I probably didn't describe it accurately enough. The table showing is just one attribute table of 42 grids. I have 42 grids, each grid is a different year. Within each grid, there are about 78,000 cells - with a different ObjectID. Each cell as a water amount for each month. All the GRIDs have the same size cells and are overlapping. The goal was to somehow determine the average water amount for each cell. Cell Statistics seemed like the way to go, but I don't think the table is set up appropriately to do this. I may have to go back to the original tables and set those up differently before creating grids from them.
- Mark as New
- Bookmark
- Subscribe
- Mute
- Subscribe to RSS Feed
- Permalink
This will only work is if the ObjectId value identifying each cell is identical across all tables, or there is some other common ID value field the preserves a common CELL ID across all 42 of your GRID tables. If the ObjectID is the only field that uniquely identifies each cell, then it must first be calculated into a Long field that will make its value permanent when you merge the tables. If the ObjectIDs are randomly assigned to any given cell across the tables, they you would first have to come up with a spatial method to assign each cell a specific unique value that is stable across all years and contained in every GRID table to perform any kind of summary by cell.
So first create a LONG field called CELL in every table and calculate the ObjectID of every table into it. Then merge all of the tables into one table. Then use the Summary Statistics tool and use the CELL field as the Unique Case field and each month field as a Summary field with the Mean summary type. All 78,000 cells will have their average created when the CELL field collapses to a single row for each CELL value with 12 columns of Means of the months of the year. This output summary table can then be joined back to the original 42 tables on the CELL field to compare each cell's actual annual month value to the corresponding 42 year mean (average) month column, if you wish to do that.
- Mark as New
- Bookmark
- Subscribe
- Mute
- Subscribe to RSS Feed
- Permalink
Thank you so much for the suggestion. I think that will do it!!!
- Mark as New
- Bookmark
- Subscribe
- Mute
- Subscribe to RSS Feed
- Permalink
The example table ... is it a grid table? or have you converted it? If it is a grid, are your zones consistent between grids? did you join a table to the grid table? the answers will indicate the shortest solution
- Mark as New
- Bookmark
- Subscribe
- Mute
- Subscribe to RSS Feed
- Permalink
The example table is a grid table and the zones are consistent. The GRIDs were created from joining a table to a grid table.