- Home
- :
- All Communities
- :
- Products
- :
- ArcGIS Spatial Analyst
- :
- ArcGIS Spatial Analyst Questions
- :
- Re: Cell statistics results are out of range of in...
- Subscribe to RSS Feed
- Mark Topic as New
- Mark Topic as Read
- Float this Topic for Current User
- Bookmark
- Subscribe
- Mute
- Printer Friendly Page
Cell statistics results are out of range of input rasters (ArcMap 10.3.1)
- Mark as New
- Bookmark
- Subscribe
- Mute
- Subscribe to RSS Feed
- Permalink
- Report Inappropriate Content
I am using Cell Statistics (Spatial analyst/Local) to calculate mean values for a set of 32 bit floating point rasters; all the same size and source (a NetCDF), identical cell size, and numbers of rows and columns. The resulting overall mean raster has high values that are greater than ANY of the input rasters for which I want the mean value. All of the high values are near or somewhat near NoData values (but some are in the center of Florida, not near the raster edges). I've tried checking and unchecking the ignore no data option. Any help with this? I've seen some older posts about a bug that 10.4 has addressed, but that is not an option for me. Thanks.
- Mark as New
- Bookmark
- Subscribe
- Mute
- Subscribe to RSS Feed
- Permalink
- Report Inappropriate Content
no data is not being ignored then, are you sure all values that are supposed to be nodata have been appropriately assigned? Do you have the bug reference so we don't have to look it up?
You could always convert your data to numpy arrays and you can calculate the stats readily using either multidimensional masked arrays or mask manually and use nan statistics (ie nanmean)
- Mark as New
- Bookmark
- Subscribe
- Mute
- Subscribe to RSS Feed
- Permalink
- Report Inappropriate Content
Thanks, Dan. Here is where I found the reference to a bug, nearly to the end of the post (Right above, but post-dating a comment by you, actually!) https://community.esri.com/thread/173734?q=cell%20statistics%20Arc
And thanks for the suggestion, but I'm afraid it has reached beyond my abilities. Never used numpy arrays or masked arrays or nanmeans. I did try using a mask in the Cell Stats run, but that did not seem to help, either.
- Mark as New
- Bookmark
- Subscribe
- Mute
- Subscribe to RSS Feed
- Permalink
- Report Inappropriate Content
Ok... I would try Xugang Wang's suggestion of using the copy raster to convert to the new data type, but make sure you specify all the information in the Environments tab. Esri grids' are pretty bullet proof as long as you use paths without spaces and limit the filename to <10 characters. Run the stats on those as well. Numpy is definitely my preference as you can see from the 6000 raster link... but I digress.
You could also scale up a floating point raster by a factor of 10, take the 'int', do the stats and scale those back down by a factor of 10. You will get some results with fewer head bruises. Keep us posted.
- Mark as New
- Bookmark
- Subscribe
- Mute
- Subscribe to RSS Feed
- Permalink
- Report Inappropriate Content
Thanks. Yuck, BTW. I have 30 rasters in two time periods from each of three global climate models, so that's 180 rasters to convert or integerize. Did I mention I'm not much of a batch processor? I'd love to hear any updates on the fix for Cell Statistics in 10.4 and if there is a patch for 10.3. Gah.
Oh, and one option in X. Wang's suggestion to the other question was to convert their rasters to floating point, which is what my rasters already are. Any light you can shed on that?
- Mark as New
- Bookmark
- Subscribe
- Mute
- Subscribe to RSS Feed
- Permalink
- Report Inappropriate Content
as for changes, I maintain a running list of the changelogs in Bugs and issues address in one of my blog posts
well you can rule out the floating point if it is already in that format.
- Mark as New
- Bookmark
- Subscribe
- Mute
- Subscribe to RSS Feed
- Permalink
- Report Inappropriate Content
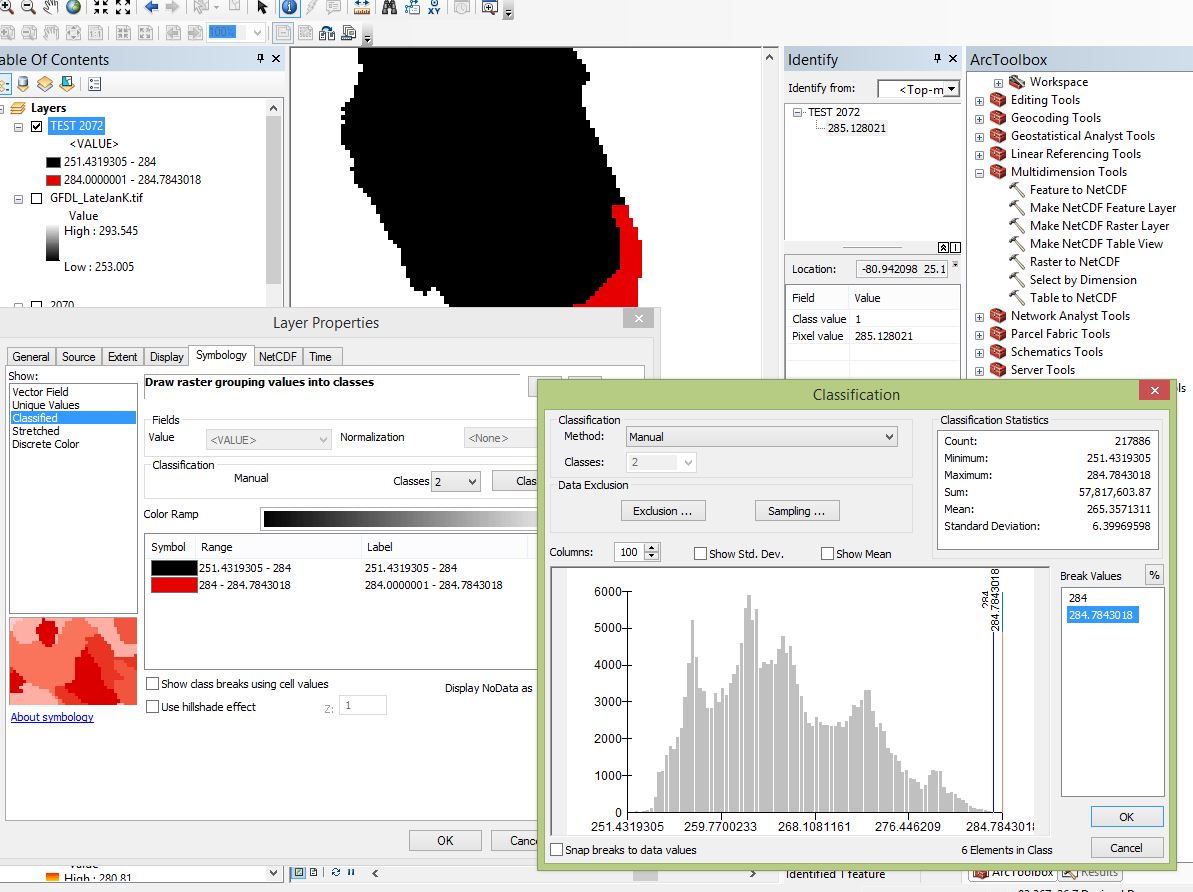
Aha! I think I found the problem, and it's NOT with Cell Statistics.
As I mentioned, most of the out-of range data were in Florida. The data are projected minimum January temperatures, and of course, in the US, South Florida is among the hottest places in January. The Cell Statistics Data are correct, but the statistics in the Symbology classifier are wrong. See the image below. I selected an especially hot year (2072); the classifier says that the maximum value is 284.7843018 (ok, these temperature data are Kelvin BTW, not Celsius. Otherwise we would be in deep doo-doo). So I classified into two groups, with 284 as the cutoff. The classifier says there are 6 elements above my cut-off value. But, if you look at the partial image of Florida, You will see a lot of 6 cells colored red. And if you look at the "identify" box, you will see that the pixel I have identified has a value of 285.128021, well outside the range that the classifier says exists in the raster. I clicked around in the red area, and there are more than 6 unique values. Stack up 30 rasters (years) and South Florida will show lots of these "out of range" values. So, I am convinced that the Cell Statistics values are correct, and there is something wrong with the Symbology classifier. Which does not bother me right this moment.
If anyone can shed light on this problem, I'd be happy to hear your input.
- Mark as New
- Bookmark
- Subscribe
- Mute
- Subscribe to RSS Feed
- Permalink
- Report Inappropriate Content
You may want to try to convert the raster to grids or rasters in a file geodatabase, since as Dan remarked, it seems that the NoData values are not recognized as NoData when using the NetCDF format.