- Home
- :
- All Communities
- :
- Products
- :
- ArcGIS Spatial Analyst
- :
- ArcGIS Spatial Analyst Questions
- :
- A better interpolation method for creating Chlorid...
- Subscribe to RSS Feed
- Mark Topic as New
- Mark Topic as Read
- Float this Topic for Current User
- Bookmark
- Subscribe
- Mute
- Printer Friendly Page
A better interpolation method for creating Chloride Concentration contour map
- Mark as New
- Bookmark
- Subscribe
- Mute
- Subscribe to RSS Feed
- Permalink
Hi, I am not very familar for spatial analysis knowledge. I have around 30 wells that collected sample Chloride concentration data and I want to create a contour map based on these sample data.
Does anyone know a better way to create this contour map? I know Kriging is the best way, but I only have 30 points data which is too few for Kriging.
Any other interpolation method recommended to replace Kriging like IDW, or natural neighbor? Or any way to add more sample data technically based on 30 sample points so that Kriging can be applied?
I have Spatical Analyst and 3D Analyst license in ArcGIS Desktop. I also heard of Geostatistical analyst tool, but even thought I can understand the analyzed result in the tool or transform the sample data, I think the number of sample data is still the problem. I think it's a normal situation for lots of people since it's difficult to acquire over 100 well data in a small study area.
Any help would be really appreciated!
Shuhong
- Mark as New
- Bookmark
- Subscribe
- Mute
- Subscribe to RSS Feed
- Permalink
Shuhong
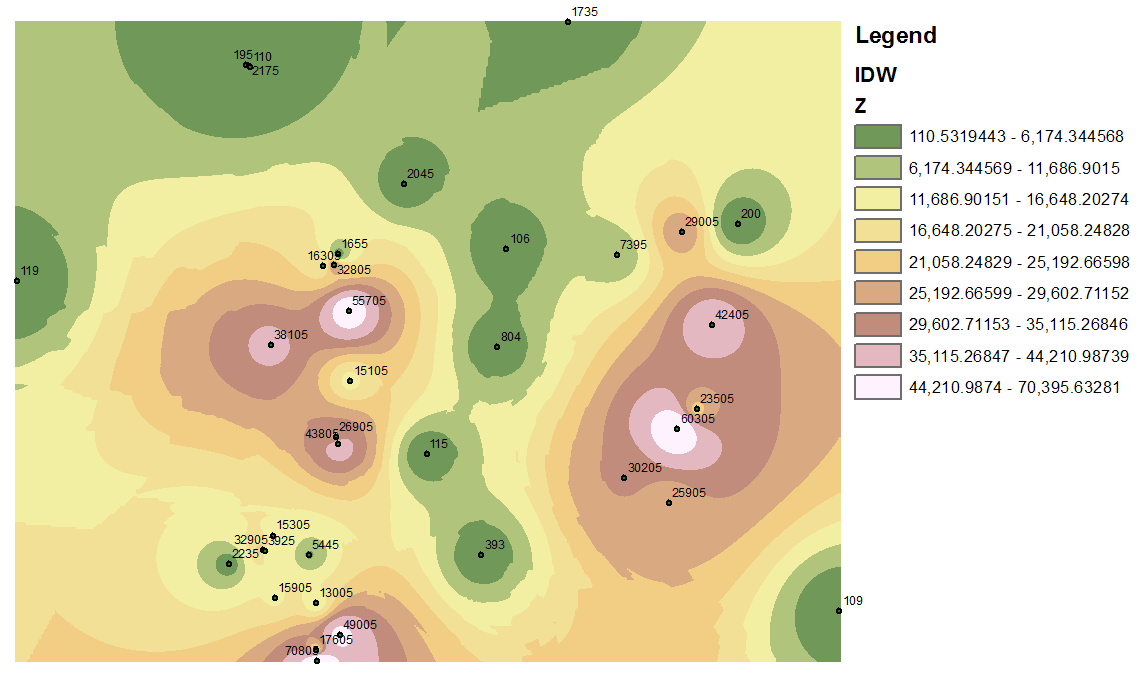
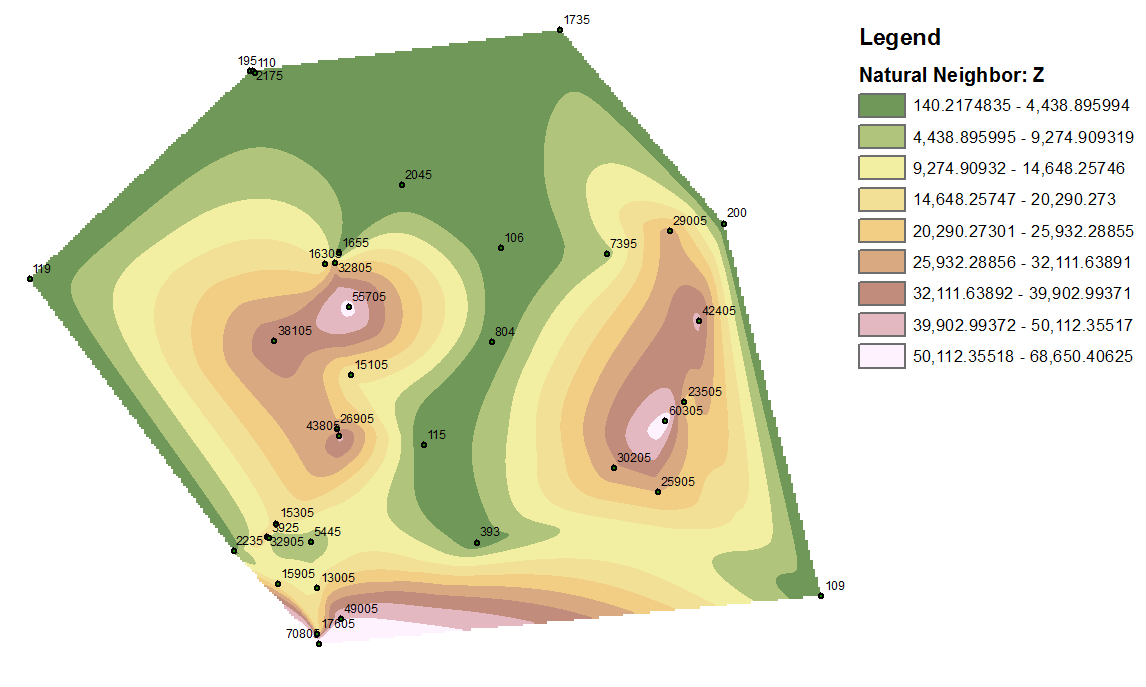
Please post an image of the output generated using IDW and Natural Neighbor.
Thanks
-Steve
- Mark as New
- Bookmark
- Subscribe
- Mute
- Subscribe to RSS Feed
- Permalink
Hi Steve,
This is the output by using IDW (classified by natural breaks for symbolization)

This is the output by using Natural Neighbor (classified by natural breaks for symbolization)

- Mark as New
- Bookmark
- Subscribe
- Mute
- Subscribe to RSS Feed
- Permalink
Why don't you create Thiessen polygons/Voronoi diagram of the pattern you have given the irregular spacing of your points (and highly clustered in some areas. It might give you a better spatial picture initially
- Mark as New
- Bookmark
- Subscribe
- Mute
- Subscribe to RSS Feed
- Permalink
I created a Thiessen polygon as you said and I understand the theory of Thiessen Polygons, but how can I use this output polygon to create the contour map?
- Mark as New
- Bookmark
- Subscribe
- Mute
- Subscribe to RSS Feed
- Permalink
maybe contours aren't the best way to represent the data and that should be considered as sell
- Mark as New
- Bookmark
- Subscribe
- Mute
- Subscribe to RSS Feed
- Permalink
What do you need the contours for?
From what I see in the IDW/Natural Neighbor output is that there are very steep gradients which will produce many contours.
The best way to decide which interpolation suits your data best is to do validation and/or cross validation.