- Home
- :
- All Communities
- :
- User Groups
- :
- ArcGIS Server with JavaScript API
- :
- Questions
- :
- ESRI Printing service not able print ArcGIS JS API...
- Subscribe to RSS Feed
- Mark Topic as New
- Mark Topic as Read
- Float this Topic for Current User
- Bookmark
- Subscribe
- Mute
- Printer Friendly Page
ESRI Printing service not able print ArcGIS JS API 3.33 RasterLayer
- Mark as New
- Bookmark
- Subscribe
- Mute
- Subscribe to RSS Feed
- Permalink
I am trying to Print map where the layer in the web application is a RasterLayer
The slider in the web app mask's the RasterLayer.
I am using ArcGIS JS API 3.33
Following is the code smaple
NOTE: To run the sample you would need to update the printing service URL at line number 127
<!DOCTYPE html>
<html>
<head>
<meta http-equiv="Content-Type" content="text/html; charset=utf-8">
<meta name="viewport" content="initial-scale=1, maximum-scale=1,user-scalable=no">
<title>Raster Layer with Pixel Filter</title><link rel="stylesheet" href="https://js.arcgis.com/3.33/dijit/themes/claro/claro.css">
<link rel="stylesheet" href="https://js.arcgis.com/3.33/esri/css/esri.css"><style>
html, body, #map
{
width: 100%;
height: 100%;
margin: 0;
padding: 0;
}
#status
{
background-color: #000;
color: #FFF;
border: solid 1px #FFF;
-moz-border-radius: 5px;
-webkit-border-radius: 5px;
border-radius: 5px;
padding: 3px;
position: absolute;
right: 10px;
bottom: 10px;
z-index: 99;
}
.shadow
{
-moz-border-radius: 6px;
-webkit-border-radius: 6px;
border-radius: 6px;
background-color: #FFF;
padding: 8px;
}
#footer
{
height: 90px;
width: 50%;
margin: 0 auto;
padding: 15px;
position: absolute;
bottom: 20px;
left: 20px;
z-index: 30;
}/* make all dijit buttons the same width */
.dijitButton .dijitButtonNode, #drawingWrapper, #printButton {
width: 160px;
}
</style><script type="text/javascript" src="https://js.arcgis.com/3.33/"></script>
<script>
require([
"esri/map",
"esri/domUtils",
// "dojo/parser",
// "dojo/dom",
// "dojo/dom-construct",
"dojo/on",
"dijit/registry",
"esri/layers/RasterLayer",
"esri/geometry/Extent",
"esri/SpatialReference",
"dijit/form/HorizontalSlider",
"dojox/form/RangeSlider",
"dijit/form/HorizontalRule",
"dijit/form/HorizontalRuleLabels",
"esri/layers/ImageServiceParameters",
"esri/layers/MosaicRule",
"esri/layers/RasterFunction",
"esri/layers/DimensionalDefinition","esri/toolbars/draw", "esri/dijit/Print",
"esri/layers/ArcGISTiledMapServiceLayer", "esri/layers/ArcGISDynamicMapServiceLayer",
"esri/layers/LayerDrawingOptions",
"esri/symbols/SimpleMarkerSymbol", "esri/symbols/SimpleLineSymbol",
"esri/symbols/SimpleFillSymbol", "esri/graphic",
"esri/renderers/ClassBreaksRenderer",
"esri/config",
"dojo/_base/array", "esri/Color", "dojo/parser",
"dojo/query", "dojo/dom", "dojo/dom-construct",
"dijit/form/CheckBox", "dijit/form/Button","dijit/layout/BorderContainer", "dijit/layout/ContentPane", "dojo/domReady!"
], function(
Map,domUtils, on, registry, RasterLayer, Extent,
SpatialReference, HorizontalSlider, RangeSlider, HorizontalRule, HorizontalRuleLabels,
ImageServiceParameters, MosaicRule, RasterFunction, DimensionalDefinition,Draw, Print,
ArcGISTiledMapServiceLayer, ArcGISDynamicMapServiceLayer,
LayerDrawingOptions,
SimpleMarkerSymbol, SimpleLineSymbol,
SimpleFillSymbol, Graphic,
ClassBreaksRenderer,
esriConfig,
arrayUtils, Color, parser,
query, dom, domConstruct,
CheckBox, Button
) {
parser.parse();
var currentMin, currentMax;
var rasterUrl = "https://sampleserver6.arcgisonline.com/arcgis/rest/services/ScientificData/SeaTemperature/ImageServer";//set up slider
var slider = registry.byId("pixelSlider");var initExtent = new Extent(-130, -68, 150, 68, new SpatialReference(4326));
var map = new Map("map", {
extent: initExtent,
basemap: "gray"
});var printer = new Print({
map: map,
url: "UPDATE_YOUR_PRINTING_SERVICE_URL"
}, dom.byId("printButton"));
printer.startup();
var sliderMin = -3; //min sea surface temp of -3 deg C
var sliderMax = 37; //max sea surface temp of 37 deg C
slider.minimum = sliderMin;
slider.maximum = sliderMax;
slider.value = [sliderMin, sliderMax];// hook up slider events
slider.on("mouseup", setPixelFilter);
slider.on("change", setPixelFilter);//set up slider labels
var sliderLabels = new HorizontalRuleLabels({
container: "bottomDecoration",
labels: [sliderMin.toFixed(0).toString(), sliderMax.toFixed(0).toString()]
}, domConstruct.create("div", {}, dom.byId("pixelLabels")));//set up blue to red color ramp inside array
var colorRamp = [];
for (var i = 0; i < 256; i++) {
colorRamp.push( [i, 30, 255 - i] );
}/***************************************************************
* This image service has multiple dimensions including depth and time.
* If you are only interested in viewing temperatures at a specific time
* and at a specific depth, use dimensional definisions
**************************************************************/var dim = []; //define dimensional definition as array
//DEPTH: show only temperatures at sea surface
dim.push(new DimensionalDefinition({
variableName: "water_temp",
dimensionName: "StdZ", //water depth
values: [0], //sea surface or 0ft
isSlice: true
}));
//TIME: only show temperatures for the week of April 7, 2014
dim.push(new DimensionalDefinition({
"variableName": "water_temp",
"dimensionName": "StdTime", //time temp was recorded
"values": [1396828800000], //Week of April 7, 2014
"isSlice": true
}));var defaultMosaic = {};
defaultMosaic.multidimensionalDefinition = dim;
var params = new ImageServiceParameters();
params.mosaicRule = new MosaicRule(defaultMosaic);//the service has a default "Stretched" function and a "None" function, we want original data "None"
var rf = new RasterFunction();
rf.functionName = "None";
params.renderingRule = rf;//Define the raster layer and add to map
var rasterLayer = new RasterLayer(rasterUrl, {
opacity: 1,
pixelFilter: maskPixels,
imageServiceParameters: params
});
map.addLayer(rasterLayer);rasterLayer.on("update-start", function () {
domUtils.show(dom.byId("status"));
});
rasterLayer.on("update-end", function () {
domUtils.hide(dom.byId("status"));
});// The pixel filter
function maskPixels(pixelData) {
if (pixelData == null || pixelData.pixelBlock == null) {
return;
}
if (currentMin === undefined || currentMax === undefined) {
setPixelFilter();
}
var pixelBlock = pixelData.pixelBlock;
var pixels = pixelBlock.pixels;
var mask = pixelBlock.mask;
var numPixels = pixelBlock.width * pixelBlock.height;
var minVal = rasterLayer.bands[0].min;
var maxVal = rasterLayer.bands[0].max;
var factor = 255.0 / (maxVal - minVal);
if (pixels == null) {
return;
}
var p1 = pixels[0];
var pr = new Uint8Array(p1.length); //set up array for red values
var pg = new Uint8Array(p1.length); //set up array for green values
var pb = new Uint8Array(p1.length); //set up array for blue valuesif (mask == null) {
mask = new Uint8Array(p1.length); //mask = new Uint8Array(p1.length);
pixelBlock.mask = mask;
}
var p = [];
//if pixel value lies between slider min and max, display it (set value to 1)
//if not, don't display it (set the value to 0)
for (var i = 0; i < numPixels; i++) {
mask = (p1 >= Math.floor(currentMin) && p1 <= Math.floor(currentMax)) ? 1 : 0;//apply color based on temperature value of each pixel
if (mask) {
p = Math.floor((p1 - minVal) * factor);
pr = colorRamp[p][0]; //red
pg = colorRamp[p][1]; //green
pb = colorRamp[p][2]; //blue
}
}pixelData.pixelBlock.pixels = [pr, pg, pb]; //assign rgb values to each pixel
pixelData.pixelBlock.statistics = null;
pixelData.pixelBlock.pixelType = "U8";
}//Redraw raster layer and dynamically change text on slider move
function setPixelFilter() {
var val = slider.get("value");
currentMin = Math.floor(val[0]);
currentMax = Math.floor(val[1]);
if (val) {
dom.byId("pixelVal").innerHTML = "Currently displaying locations with sea temperatures from " + currentMin + "°C to " + currentMax + "°C";
}
else {
dom.byId("pixelVal").innerHTML = "Currently displaying all temperatures.";
}
rasterLayer.redraw();
}
});
</script>
</head><body class="claro">
<div id="map" >
<div id="printButton"></div>
<div id="status">
Loading...
</div>
<div id="footer" class="shadow">
<span style='font-weight: 600; font-size: 130%;' id='elevSpan'>Sea Surface Temperature (°C) on April 7, 2014</span><br><br>
<div id='pixelVal'></div>
<div id="pixelSlider" data-dojo-type="dojox/form/HorizontalRangeSlider" data-dojo-props="showButtons:'false', intermediateChanges:'false', slideDuration:'0'">
<div data-dojo-type="dijit/form/HorizontalRule"></div>
<div id="pixelLabels"></div>
</div>
</div>
</div>
</body></html>
Following is how the app looks like: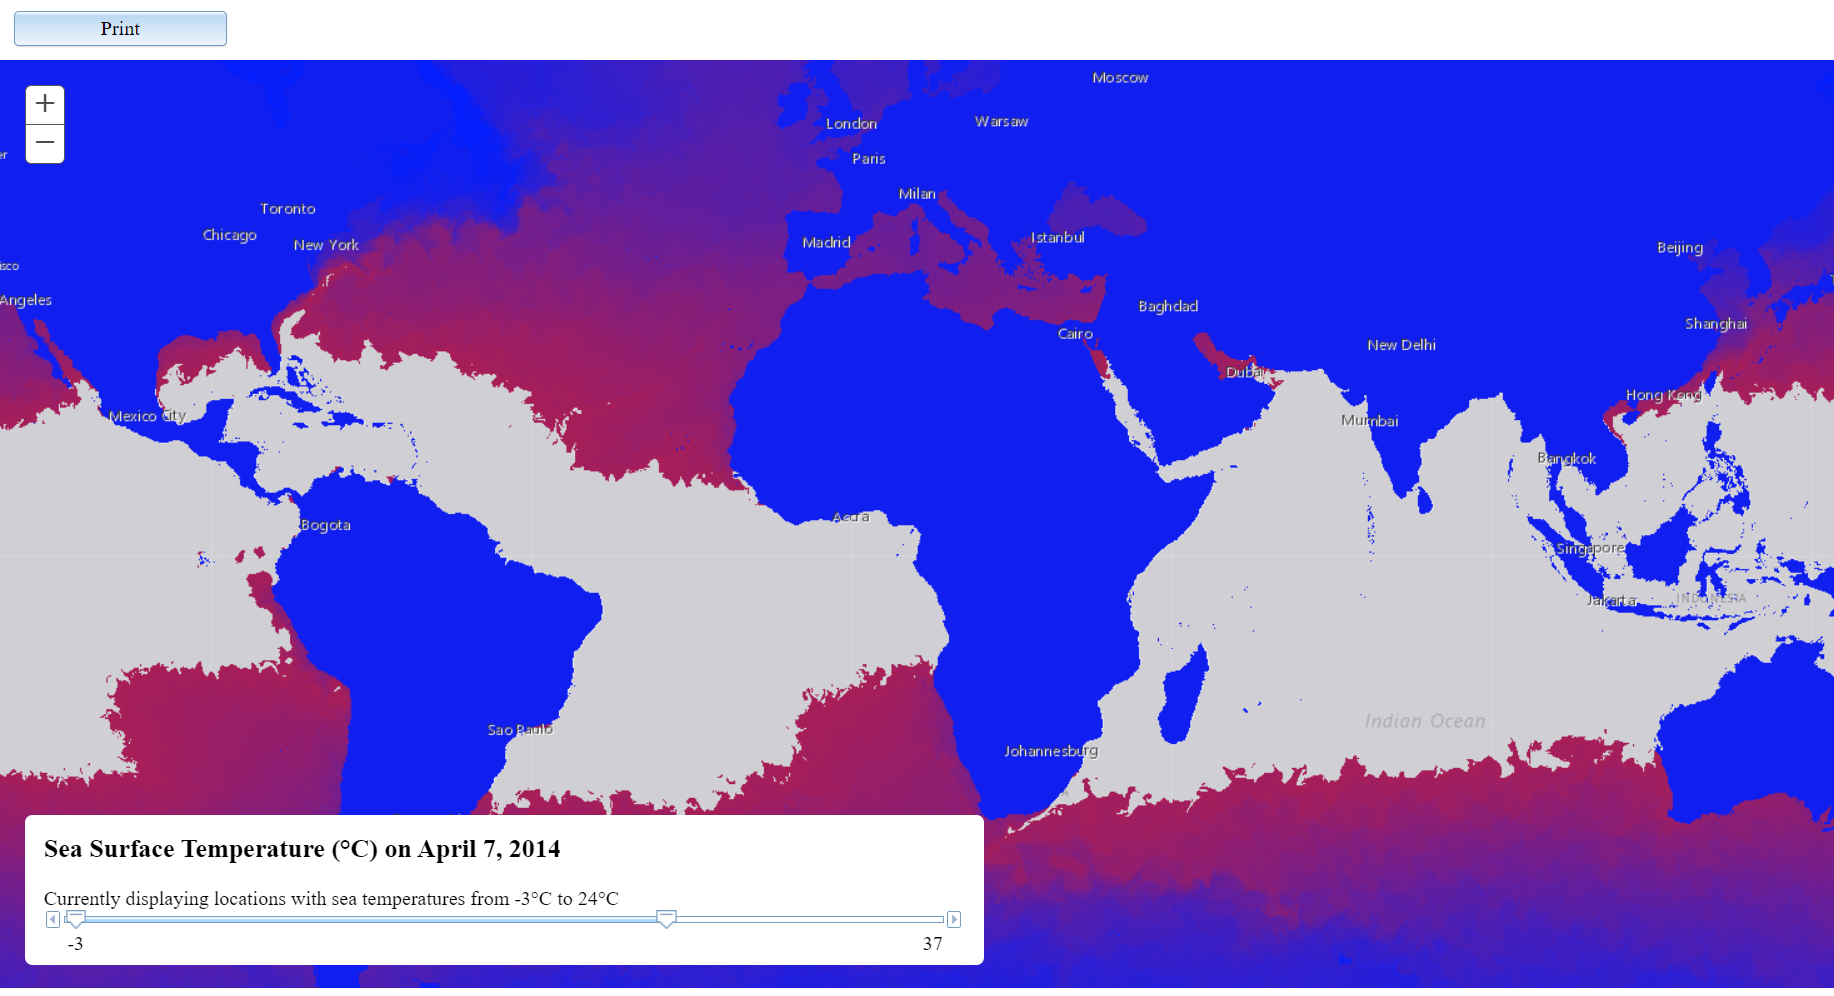
The printing result looks like following:
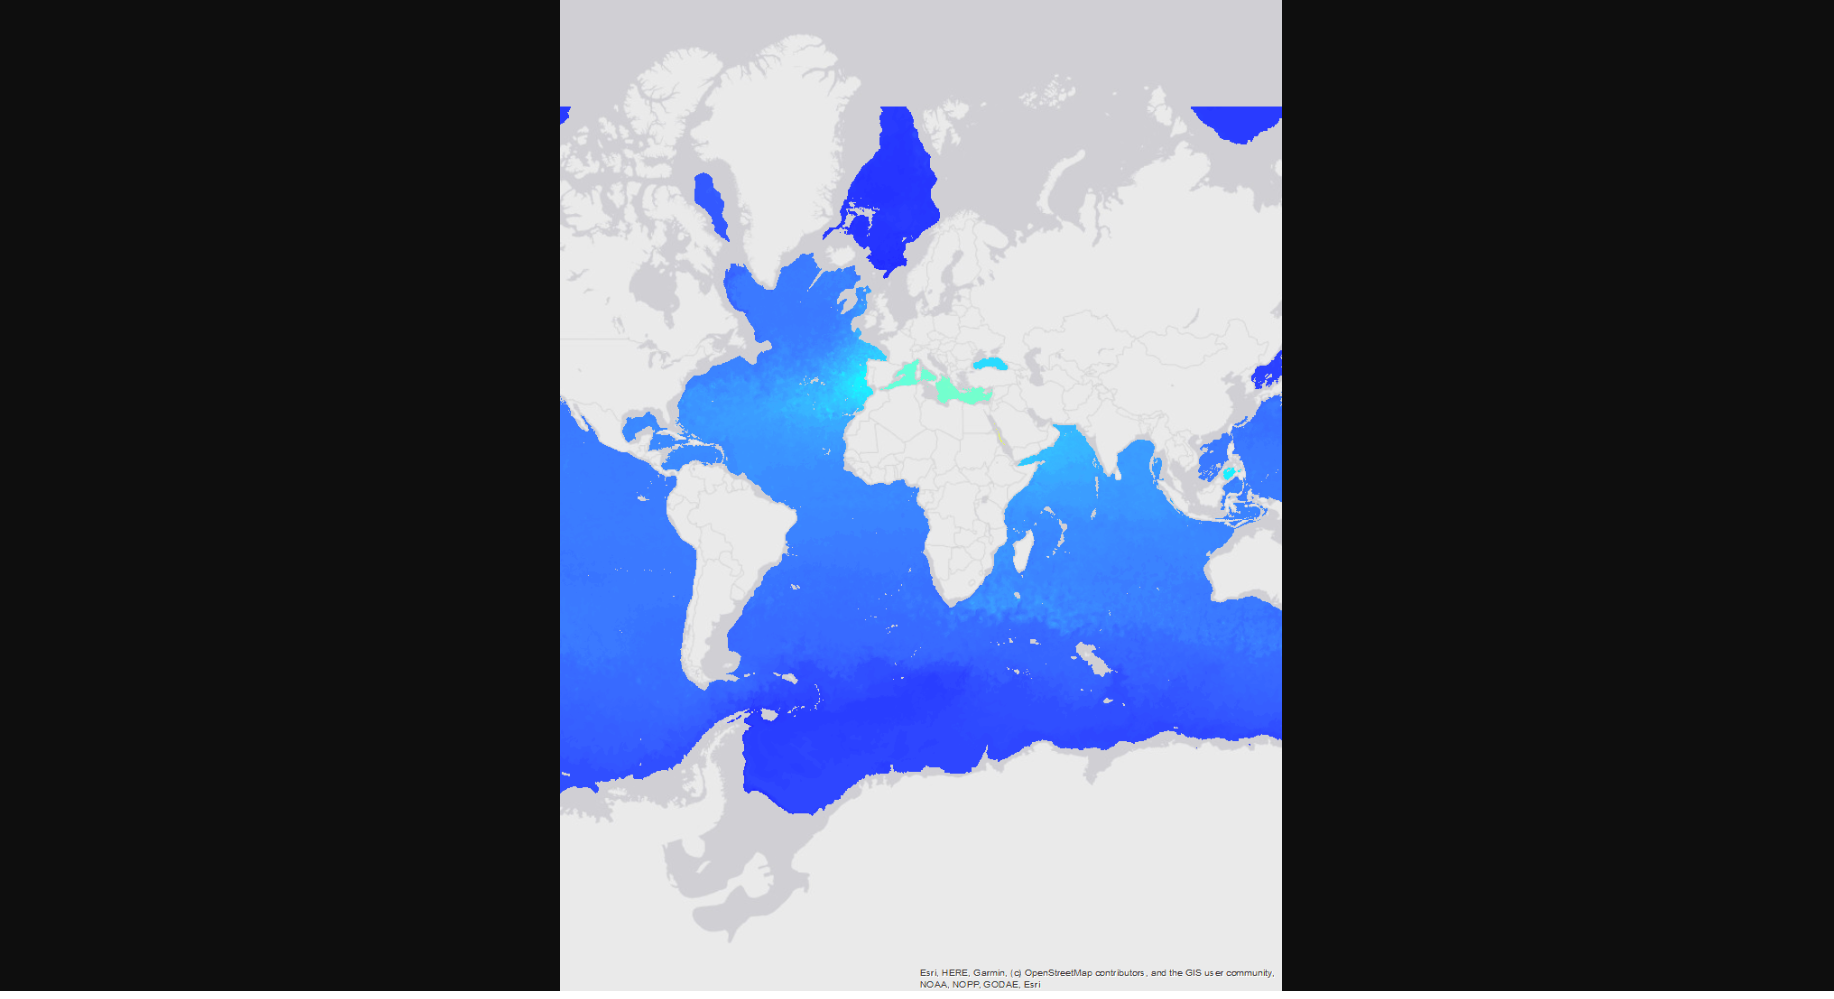
Notice the threshold applied for masking values in the web application are not acknowledged by the print service.
Any suggestions would be really helpful.
Thank you.