- Home
- :
- All Communities
- :
- Products
- :
- ArcGIS Pro
- :
- ArcGIS Pro Questions
- :
- Re: Show polygon feature or self created chart in ...
- Subscribe to RSS Feed
- Mark Topic as New
- Mark Topic as Read
- Float this Topic for Current User
- Bookmark
- Subscribe
- Mute
- Printer Friendly Page
Show polygon feature or self created chart in Popup
- Mark as New
- Bookmark
- Subscribe
- Mute
- Subscribe to RSS Feed
- Permalink
Hi, I'm trying to show feature layers in pop-ups. I wanna put the polygon (borehole view) with unique ID into pop-ups when I click the polygon, or show charts of borehole views in pop-ups. With research work done, I understand that creating attachments to the attribute table allows me to show the borehole profiles (picture form) in pop-ups. However, may I know if it is possible to show polygons created in pop-ups.
The picture is the sort of result I wanna achieve. Any help would be greatly appreciated.
Thanks,
Matthew
- Mark as New
- Bookmark
- Subscribe
- Mute
- Subscribe to RSS Feed
- Permalink
Hi @MatthewLau,
There are a few ways in which you could accomplish this, but they are fairly extensive and may require knowledge of some kind of programming (primarily python) to generate a polygon shape. But it all depends on which direction you wish to take.
Based on the image, is the image a profile of the borehole? I am somewhat familiar with these, so I have some knowledge of what they are.
If the image you are looking to create is that of a vertical profile of the borehole, then perhaps a chart would be best. However, if you are looking to have some kind of complex viewing angles for the borehole, then a report might be more suitable in which case you could add the report as an attachment.
- Mark as New
- Bookmark
- Subscribe
- Mute
- Subscribe to RSS Feed
- Permalink
Thank you for the reply! Yes, indeed, I wanna show a vertical profile of the borehole based on tables containing X, Y, Z coordinates as well as "From Top" and "To Bottom" information etc. May I know if you could give some suggestions on how to add charts to the pop-up as I have a large number of borehole data (around 30k).
Thanks again for the help! Really appreciated!
P.S. Python is totally fine to me
Matthew
- Mark as New
- Bookmark
- Subscribe
- Mute
- Subscribe to RSS Feed
- Permalink
Hi @MatthewLau,
Do you simply need a 2D graph or a 3D graph? If you are interested in the 3D graphs, click here to see some samples. If it is simply 2D with various views(Top with Dimensions, and Profile), then you can combine the stacked graph and either an image or html created object to indicate the top of the borehole with lines showing the x and y coordinates and using the graph for the elevations.
Also, are these popups for ArcPro or ArcGIS Online? Just getting more clarity so to help direct you in the the direction you wish to go.
- Mark as New
- Bookmark
- Subscribe
- Mute
- Subscribe to RSS Feed
- Permalink
Thanks again for the suggestions. I actually already created 3D polyline features with ArcGIS Pro. Then I wanna show 2D borehole view (indicating the top and bottom level of various soil layers within the same borehole ID). I have tried to use the stacked graph so as to obtain the effect that I want. However, I failed and am not sure where's wrong. Does it mean I need to use matplotlib to create 2D borehole views and save them as images and follow by adding attachments? This is the solution I figured out so far, any suggestion is welcome.
My idea is to create the 2D view in ArcGIS Pro in advance, so it allows to share in ArcGIS Online for the industry to use and view.
Thanks again for the help!
Matthew
- Mark as New
- Bookmark
- Subscribe
- Mute
- Subscribe to RSS Feed
- Permalink
Below is an example on how to set up the stacked bar graph by having a generic field for the soil and have a a field name for the soil and the attribute value as the depths. I don't know if it works well with negative values but you could give that a try.

This is kind of a poor example but it should get you close to what you are trying to do.
- Mark as New
- Bookmark
- Subscribe
- Mute
- Subscribe to RSS Feed
- Permalink
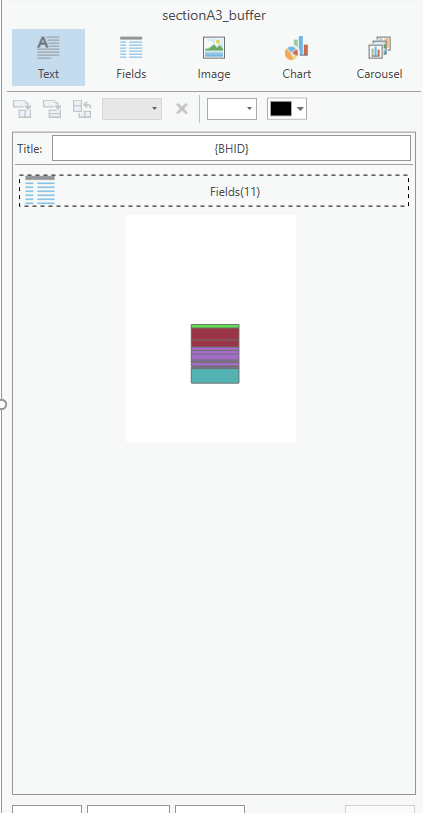
Thanks again! I have tried to follow the method you suggested. It works only when I create charts in ArcGIS Pro, like the following.

Still, I could not find an alternative to show a similar result in the pop-up setting.

May I know if there's any way to do stacked chart in pop-up?
Matthew