- Home
- :
- All Communities
- :
- Products
- :
- ArcGIS Pro
- :
- ArcGIS Pro Questions
- :
- Re: Report Example
- Subscribe to RSS Feed
- Mark Topic as New
- Mark Topic as Read
- Float this Topic for Current User
- Bookmark
- Subscribe
- Mute
- Printer Friendly Page
Report Example
- Mark as New
- Bookmark
- Subscribe
- Mute
- Subscribe to RSS Feed
- Permalink
Hello!
I would recommend starting with our help documentation: Reports in ArcGIS Pro—ArcGIS Pro | Documentation. When creating the report, it sounds like you will want to use a Basic Summary template: Report templates and styling—ArcGIS Pro | Documentation
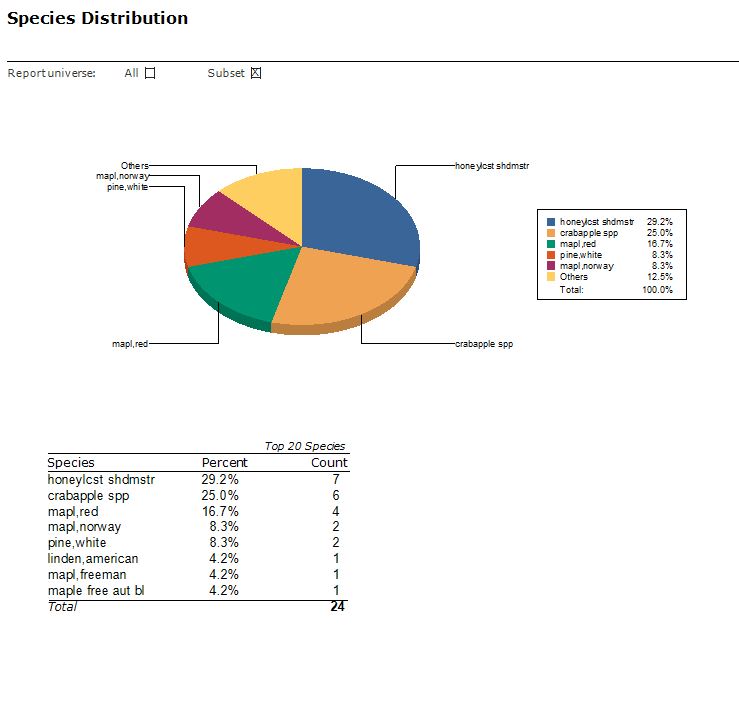
If the report's data source is a map layer, you can create charts: Make a chart—ArcGIS Pro | Documentation; then, you can include them in your report: Include a chart frame—ArcGIS Pro | Documentation.
I hope this helps!
- Alycia
- Mark as New
- Bookmark
- Subscribe
- Mute
- Subscribe to RSS Feed
- Permalink
Thanks Alycia. The tutorial gets me part of the way there.
I can run a report and display an attribute value(s) for the records in the reports but how would I customize the report to run a custom calculation?
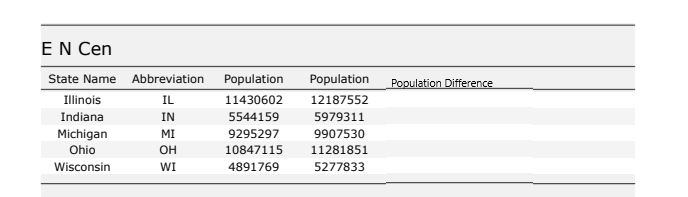
For instance, in the ESRI Tutorial: Tutorial: Create and modify a report—ArcGIS Pro | Documentation , how would a user run the report by displaying Population Difference for each state (Population 2000-Population 1990) for each record.
Please see the attached png.
Thanks,
Scott
- Mark as New
- Bookmark
- Subscribe
- Mute
- Subscribe to RSS Feed
- Permalink
@ScottLehto3 and @AlyciaRajendran_esri I am also trying to determine how to do calculations within the report function without having to add new fields to my feature class. Are calculations within the report function in Pro supported? Thanks! Siona