- Home
- :
- All Communities
- :
- Products
- :
- ArcGIS Pro
- :
- ArcGIS Pro Questions
- :
- Re: Python or ModelBuilder Help
- Subscribe to RSS Feed
- Mark Topic as New
- Mark Topic as Read
- Float this Topic for Current User
- Bookmark
- Subscribe
- Mute
- Printer Friendly Page
Python or ModelBuilder Help
- Mark as New
- Bookmark
- Subscribe
- Mute
- Subscribe to RSS Feed
- Permalink
Hello All,
I am trying to transition to ArcGIS Pro. I am not very good at programming and needed some help with either Python or ModelBuilder.
I am tasked with creating maps for our documents to show sampling locations. I currently have all the layers such as the basemap, roads, boundaries, etc. added to the project. Currently, I manually import an edited excel file and I use the "display XY Data" to display the Lat and Long of our tracks to the map. The attribute table contains the following information shown in the attached file.
The excel file is data we took while moving in our vehicle that is equipped with GPS. What I am trying to do is use the information and place a marker point and use a style on that point anywhere that our vehicle was parked for more than 5 min. The excel file name is never the same and is created from data from Igor. The excel file is usually named in the following format (XXXXX DAQ Data XXXXXX.xlsx) where "X" are numbers for the date and case number. I am not sure if this is possible but I figured I would start with my question here.
Hopefully I posted this in the correct area!
Thank you in advance for any help!
Justin
- Mark as New
- Bookmark
- Subscribe
- Mute
- Subscribe to RSS Feed
- Permalink
Are you sure there were any two times that were at least 5 minutes apart
all your readings are a few seconds apart. I took them into MS Access and looked for duplicate locations and the closest to 5 minutes is on that had 24 readins
Then going back to the original table there are a bunch close together. Your GPS rating is fluctuation by a few inches to feet between many readings. 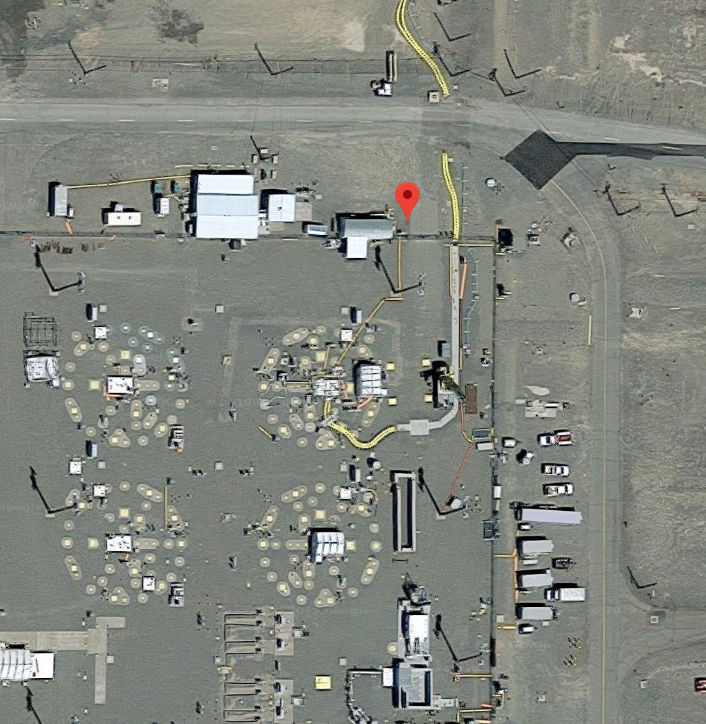
- Mark as New
- Bookmark
- Subscribe
- Mute
- Subscribe to RSS Feed
- Permalink
I found the same when I did that. I used the Find Identical tool.
- Mark as New
- Bookmark
- Subscribe
- Mute
- Subscribe to RSS Feed
- Permalink
What we are doing is driving around in an area to take samples. We then stop at random locations through out the day. If we are stopped for more than 5 minutes, the client would like me to mark that location on the map.
I have attached an example picture showing some of our tracks and stops. The blue dots represent the locations of stops we made and the yellow dots are all the data from the excel file where we were that day. As it stands now, I manually import the edited data and manually look for locations of where we made stops during the day and add a marker at those locations.
- « Previous
-
- 1
- 2
- Next »
- « Previous
-
- 1
- 2
- Next »