- Home
- :
- All Communities
- :
- Products
- :
- ArcGIS Pro
- :
- ArcGIS Pro Questions
- :
- How to create engaging legends
- Subscribe to RSS Feed
- Mark Topic as New
- Mark Topic as Read
- Float this Topic for Current User
- Bookmark
- Subscribe
- Mute
- Printer Friendly Page
- Mark as New
- Bookmark
- Subscribe
- Mute
- Subscribe to RSS Feed
- Permalink
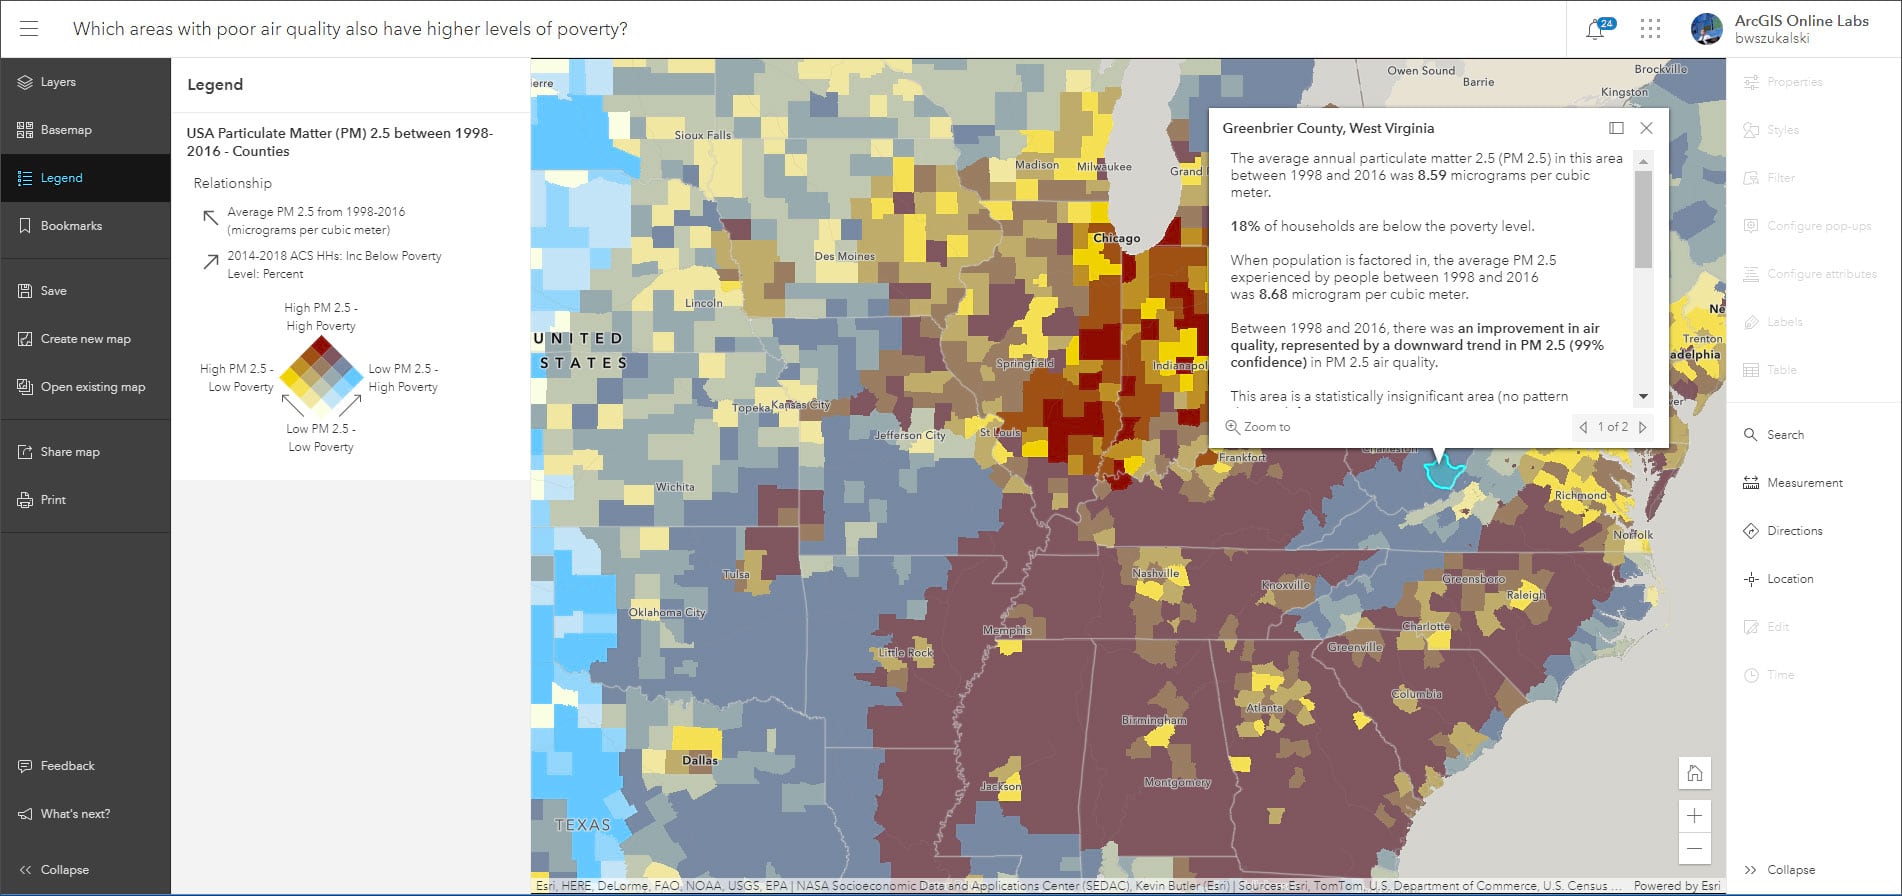
My experience of legends within ArcMap is that they are pretty boring and haven't changed much in a good few years.
I've just seen this image (https://www.esri.com/arcgis-blog/wp-content/uploads/2020/06/june3.jpg) of an engaging legend and would like to know how this has been created?
The above image is shown on this page: What’s new in ArcGIS Online (June 2020)
Solved! Go to Solution.
Accepted Solutions
- Mark as New
- Bookmark
- Subscribe
- Mute
- Subscribe to RSS Feed
- Permalink
Hi Oliver.
That is a Chloropleth map in map viewer beta with bivariate color symbology. Coming later this month with the release of ArcGIS Pro 2.6, you can author such maps that use bivariate colors to show quantitative differences. Check out this video demonstration: What's New in ArcGIS Pro 2.6 - YouTube