- Home
- :
- All Communities
- :
- Products
- :
- ArcGIS Pro
- :
- ArcGIS Pro Questions
- :
- Re: Help with Arcade expression (percentage change...
- Subscribe to RSS Feed
- Mark Topic as New
- Mark Topic as Read
- Float this Topic for Current User
- Bookmark
- Subscribe
- Mute
- Printer Friendly Page
Help with Arcade expression (percentage change)
- Mark as New
- Bookmark
- Subscribe
- Mute
- Subscribe to RSS Feed
- Permalink
Hi,
I am looking for some assistance with an arcade expression to use on ArcPro to find the percentage change of a dataset month by month.
I have provided an example dataset below.
| Location | Grand Total | Date |
| London | 2 | Dec_2021 |
| New York | 7 | Dec_2021 |
| Paris | 8 | Dec_2021 |
| London | 3 | Nov_2021 |
| New York | 7 | Nov_2021 |
| Paris | 3 | Nov_2021 |
| London | 1 | Oct_2021 |
| New York | 4 | Oct_2021 |
| Paris | 9 | Oct_2021 |
I believe the result should be as below
| Location | Grand Total | Date | Percentage change (%) |
| London | 2 | Dec_2021 | -33.33 |
| New York | 7 | Dec_2021 | 0 |
| Paris | 8 | Dec_2021 | 167.67 |
| London | 3 | Nov_2021 | 200 |
| New York | 7 | Nov_2021 | 75 |
| Paris | 3 | Nov_2021 | -66.67 |
| London | 1 | Oct_2021 | n/a |
| New York | 4 | Oct_2021 | n/a |
| Paris | 9 | Oct_2021 | n/a |
The general formula I used is below, but looking for a way to automate this as I have thousands of rows of data
((Nov_2021)-(Dec_2021))/(Nov_2021))*100
Many thanks
- Mark as New
- Bookmark
- Subscribe
- Mute
- Subscribe to RSS Feed
- Permalink
Can a location exist more than once within a single month?
- Mark as New
- Bookmark
- Subscribe
- Mute
- Subscribe to RSS Feed
- Permalink
Hi Duncan, no each location is unique for the month.
- Mark as New
- Bookmark
- Subscribe
- Mute
- Subscribe to RSS Feed
- Permalink
One option to automate this is create a model in ModelBuilder using your inputs and the Calculate Field GP tool. You can either use Python or Arcade expression for the Calculate Field GP tool parameter. To automate it, export it out from ModelBuilder as a Python script and associate the *.py script with a Basic Task in Windows Task Scheduler to run every x amount of time. You can also schedule a model to run regularly too.
- Mark as New
- Bookmark
- Subscribe
- Mute
- Subscribe to RSS Feed
- Permalink
The first step is to simplify your input otherwise you would need some complex logic to identify as you step through the table you have gone from Paris Dec_2021 to London Nov_2021.
If your input is truly structured as you have shown then you could very easily explode out this table using the Split by attributes tool.
This creates as many tables as you have locations, the output of one such table would be:
Depending upon your input structure you may need to sort the table into a correct date sequence.
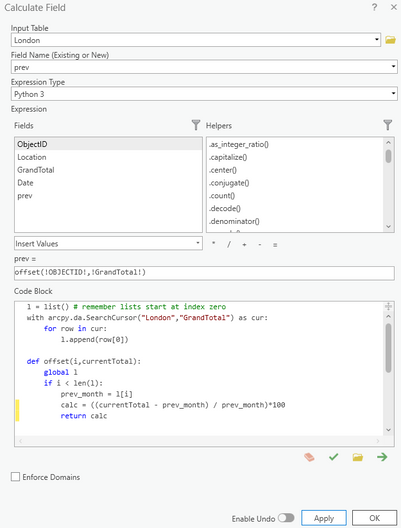
Add a new field of type double to record your change then run the following python code in a field calculate tool
Code block is:
l = list() # remember lists start at index zero
with arcpy.da.SearchCursor("London","GrandTotal") as cur:
    for row in cur:
        l.append(row[0])

def offset(i,currentTotal):
    global l
    if i < len(l):
        prev_month = l[i]
        calc = ((currentTotal - prev_month) / prev_month)*100
        return calc
In the example above I have hardwired it to read the table "London" but you could easily swap that out with an inline variable substitution from a model iterator as suggested by @Robert_LeClair


