Hi there, thanks for reading my post, I appreciate any help I can get!
So I'm looking to symbolise each habitat type for a location so I can assess the changes over time (I'm using 3 maps of the same location: 1990, 2007, 2021). However, when I attempt to symbolise and add unique values to my data, I have over a thousand unique values, all coded such as '2.84' as an example. Here are my values from the attribute table:
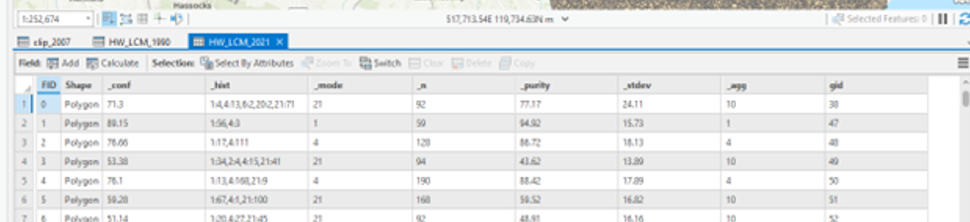
I'm really not sure what value to add to the symbology field to find the habitat coverage, and Ideally I would like to simplify the results so it looked something similar to this:
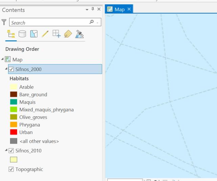
So basically I'm trying to understand the process that involves me from simplifying the habitat types so I can easily symbolise them, and read them. I hope this all makes sense and thank you.
Danny.



