Turn on suggestions
Auto-suggest helps you quickly narrow down your search results by suggesting possible matches as you type.
Cancel
- Home
- :
- All Communities
- :
- Products
- :
- ArcGIS Pro
- :
- ArcGIS Pro Questions
- :
- Can ArcGIS Pro do Pie Chart Symbology for Points?
Options
- Subscribe to RSS Feed
- Mark Topic as New
- Mark Topic as Read
- Float this Topic for Current User
- Bookmark
- Subscribe
- Mute
- Printer Friendly Page
Can ArcGIS Pro do Pie Chart Symbology for Points?
Subscribe
09-08-2016
10:26 AM
- Mark as New
- Bookmark
- Subscribe
- Mute
- Subscribe to RSS Feed
- Permalink
I am trying to do the pie chart symbology in ArcGIS Pro. I can't seem to find this option in the symbology. I was wondering if this is an option, and if not, is it planned to be added at some point?
Solved! Go to Solution.
31 Replies
09-30-2019
06:07 AM
- Mark as New
- Bookmark
- Subscribe
- Mute
- Subscribe to RSS Feed
- Permalink
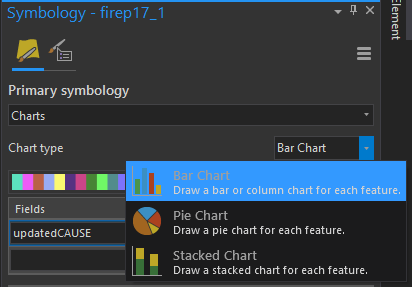
Preview from Pro 2.5:

When choosing Charts as the Primary symbology type, it will default to Bar Chart, and include Pie Chart and Stacked Chart as options.
ArcGIS Pro 2.5 is scheduled to be available in January 2020!
09-30-2019
06:29 AM
- Mark as New
- Bookmark
- Subscribe
- Mute
- Subscribe to RSS Feed
- Permalink
Great! Thanks Kory. Hopefully a couple of the symbology bugs/issues from ArcMap are fixed. Namely the following:
- Any constituent in the pie that is <1% does not get a slice. I get it, it would be an extremely small slice, but still good to see that extremely small slice when zoomed in on a map.
- When selected to adjust the size of the pie chart based on a field, the sizing of the pie chart varies based on some unknown distribution of the underlying dataset. For example, if I have 2 different datasets with different ranges, means, etc, but one point in each of the datasets is the exact same and set at the same size in a field, the actual sizes of those pies is different.
Any ideas about those 2 fixes?
thanks!
- « Previous
- Next »
- « Previous
- Next »