- Home
- :
- All Communities
- :
- Products
- :
- ArcGIS Pro
- :
- ArcGIS Pro Ideas
- :
- Summary Statistics for Thematic Map Legend
- Subscribe to RSS Feed
- Mark as New
- Mark as Read
- Bookmark
- Follow this Idea
- Printer Friendly Page
Summary Statistics for Thematic Map Legend
- Mark as New
- Bookmark
- Subscribe
- Mute
- Subscribe to RSS Feed
- Permalink
I always have to get number of elements from under Symbiology -> Classify and then click on each class and look at the number displayed at the bottom of the screen. Then write the numbers down and calculate the proportions/percentages in another program like Excel. Then type them into my map layout with the text tool. Not very convenient.
- « Previous
-
- 1
- 2
- Next »
I want ArcMap to be able to display Layer/Feature statistics in the Table of Contents.
My original line of thinking leading me to this request was that I wanted to be able to show the dynamic count of features in a layer as a part of the layer label. Say I have a layer of points that is driven by a definition query from a dynamic dataset, such as recent earthquakes, or customers needing a service call. . . It would be great if I could get a count of these point events as a part of the layer name and/or the feature symbol label in the Table of Contents. This would be especially powerful if I was publishing the map to a web service and it was tied to a dynamic data source.
When I was goggling to see if this was an ArcMap capability I came across this post.
http://forums.esri.com/Thread.asp?c=93&f=993&t=188213
Now I agree with this poster, and I think this is an even better idea, instead of just counts, why not any of the statistics we could use to summarize data in the table view. This summary stats code is already wrtten and the functionality to display this data is written into the legend functions, so maybe these . . .
I would like to be able to label the layer name and/or the feature symbol with the feature statistics in the Table of Contents. An even better capability would be to have the ability to dynamically build the labels with static text concatenated to dynamic statistics.
So my layers could be like these examples:
___________
Table of Contents
---Earthquakes this week (count=120)
------>Magnitude 6 (count=5)
------Magnitude 4 to 6 (count=16)
------<Magnitude 4 (count=99)
OR
Table of Contents
---Open Service Calls (count=10)
------Appliance Repair Model A (count=3)
------Maintenance Model Q (count=6)
------Machine Repair Code 2 (count=1)
------Appliance Model 1 Installation (count=0)
_______________
An even better capability would be to have the selective ability to dynamically filter these counts by the area of the map falling within the display and/or within a user defined and drawn polygon and/or by selected features. . .
To be able to see the count, or average (or some other descriptive statistic) of features in the Table of Contents becomes very useful for comparing layers, or summarizing the layer without having to open any other screen and it translates from desktop-to-server-to-browser-to-mobile device as a functionally useful capabliity.
Best Regards,
John Nowlin
Systems Developer, National Service
Stiles Machinery, Inc.
I was wondering if these stats could be in another panel in the TOC? We are able to display by draw order, source, visibility and selection, maybe we could have a new panel for stats that can be for the whole dataset or filtered by the current extent?
A simple sum of any field would be imense. Of course you couldn't have a number witout units like acres, gallons, etc. This would need to be configurable for the layer.
Other stats like average, medina, etc would be greatly helpful too.
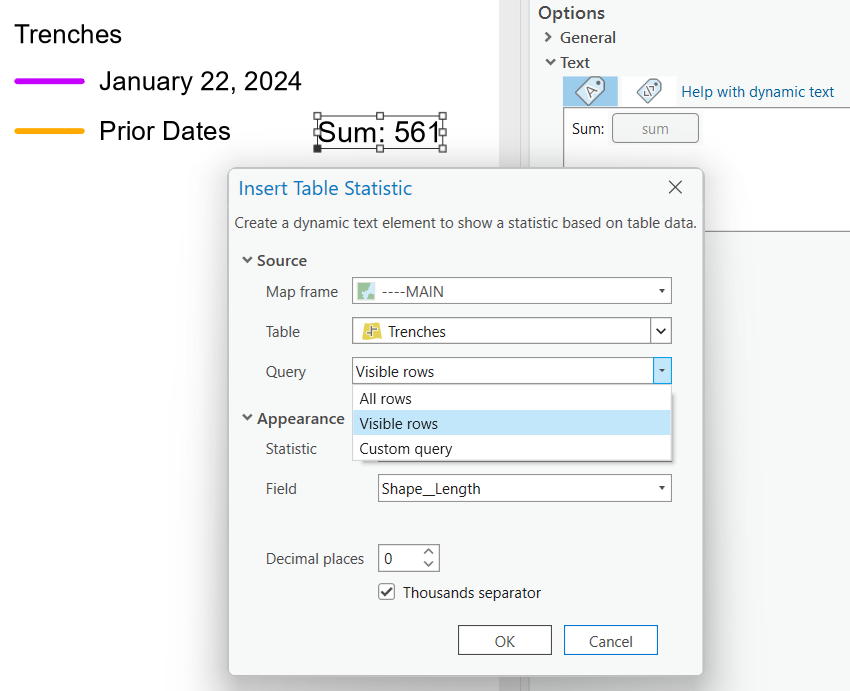
While there isn't a way to calculate statistics and have them display automatically in the legend, you can use table dynamic text to calculate statistics dynamically. You can then position this text anywhere on the layout, including near or on top of the legend. Learn more about table dynamic text here: Add dynamic text—Layouts | ArcGIS Desktop
Imagine, I have a single layer with multiple lines of two types (purple and orange) that get updated daily and I need to print out a status map every day. I want the legend to summarize the total length of red lines and the total length of green lines. The dynamic text mechanism now allows me to post only the total length of all lines in the table combined. It is already not a small deal, and I appreciate this ability. But in addition to the available options (see attached), we need the "by symbology" option too. Thanks!
You could split your lines data into 2 separate layers - one for each type - using a definition query on each layer. Then when you create the dynamic table statistics text elements, they're based on layers that are already filtered by line type and can still be limited by visible extent of the map.

@JesseWickizer - Thanks for the tip! Of course, I knew this trick and it's exactly how I did it today. But I was hoping for a more elegant and simple solution (something like you do with labels).
You must be a registered user to add a comment. If you've already registered, sign in. Otherwise, register and sign in.