Turn on suggestions
Auto-suggest helps you quickly narrow down your search results by suggesting possible matches as you type.
Cancel
- Home
- :
- All Communities
- :
- Products
- :
- ArcGIS Pro
- :
- ArcGIS Pro Ideas
- :
- Restore lost line graph functionality from ArcGIS ...
Options
- Subscribe to RSS Feed
- Mark as New
- Mark as Read
- Bookmark
- Follow this Idea
- Printer Friendly Page
Restore lost line graph functionality from ArcGIS 9.2/9.3
Follow this Idea
858
1
11-15-2013 10:15 AM
Status:
Open
- Mark as New
- Bookmark
- Subscribe
- Mute
- Subscribe to RSS Feed
- Permalink
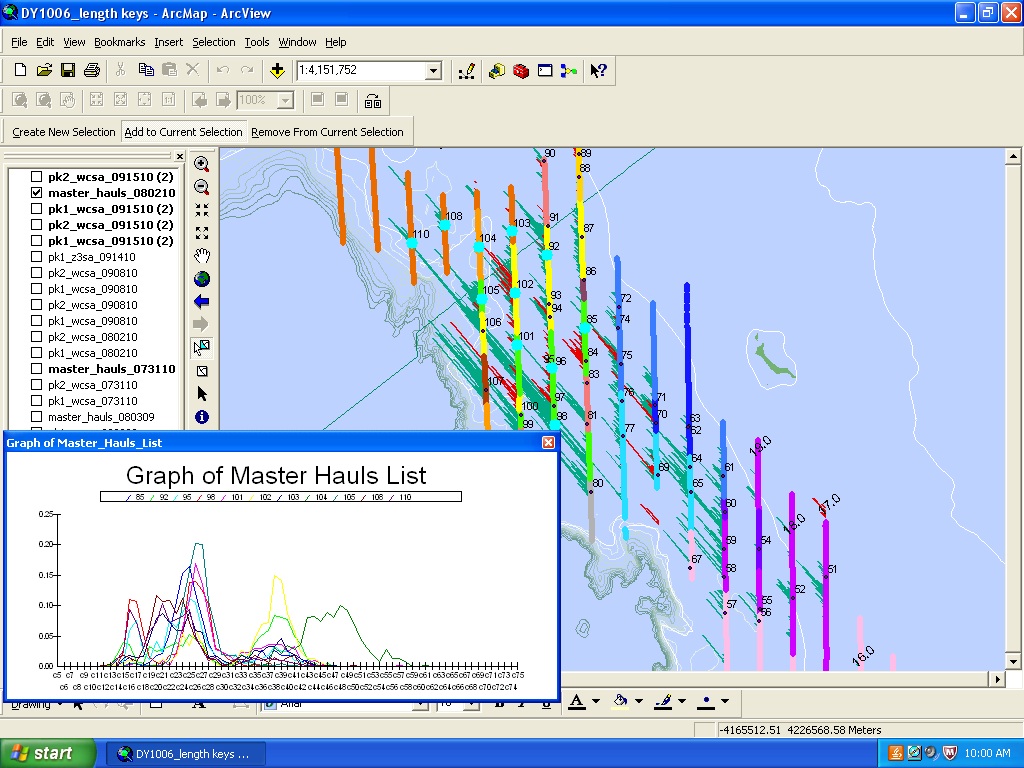
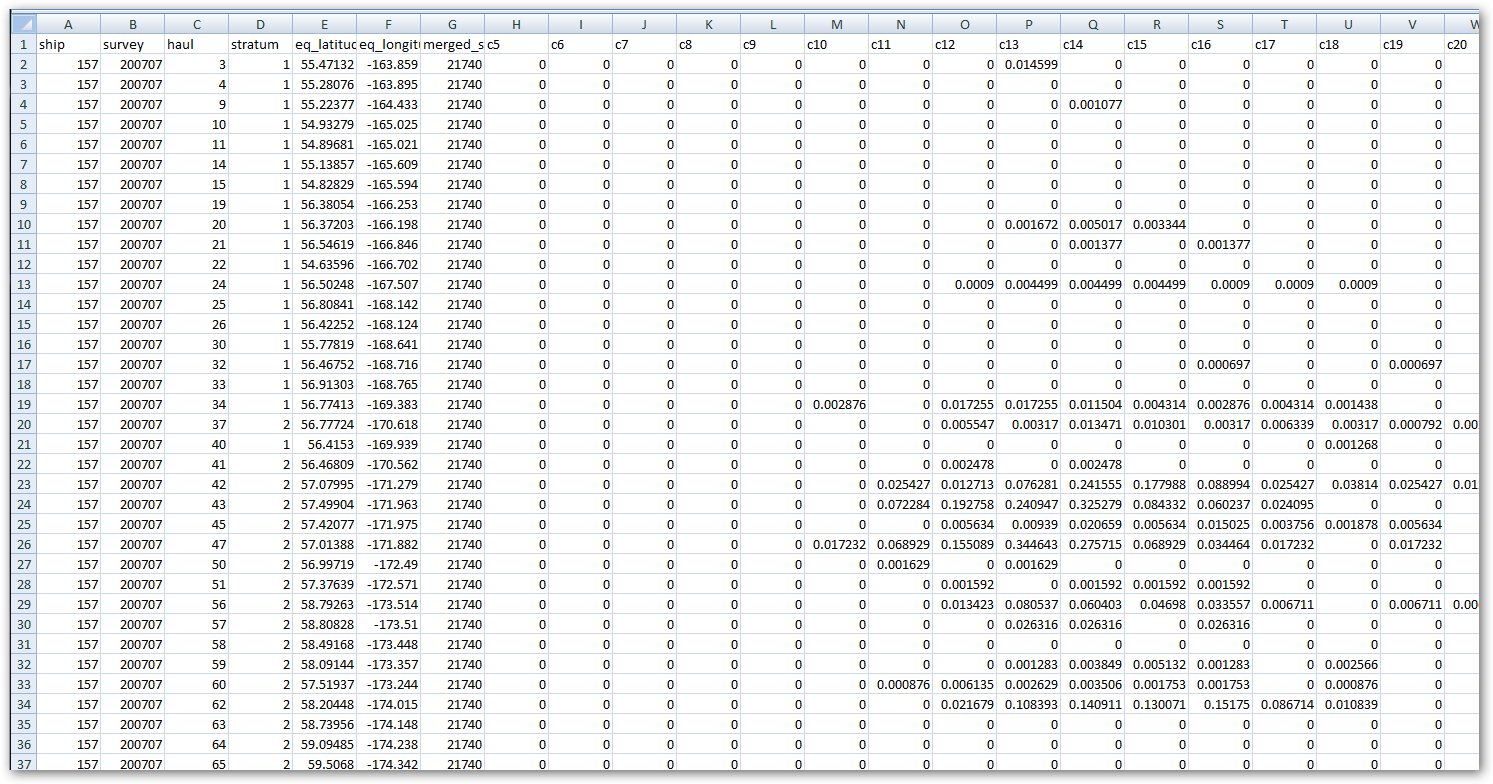
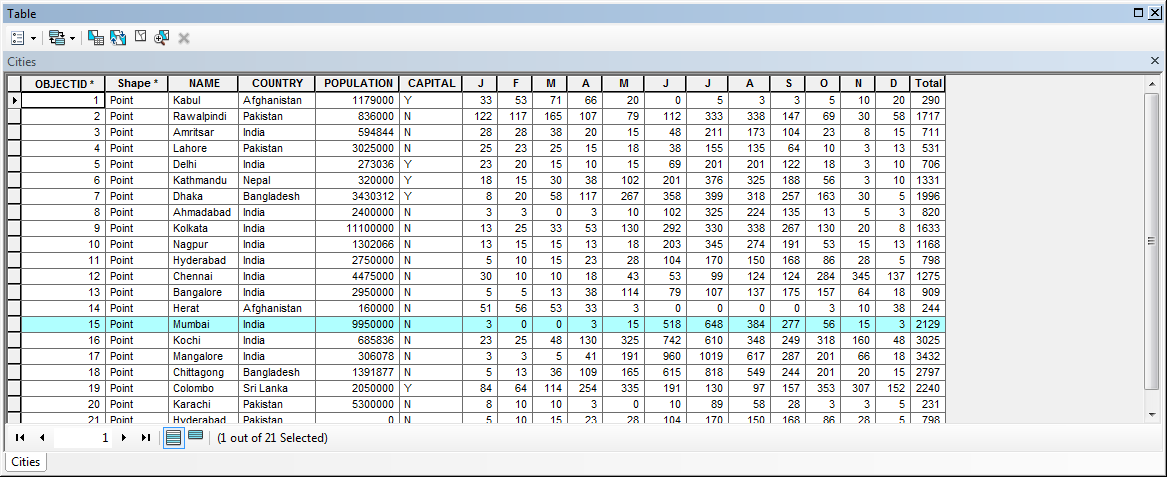
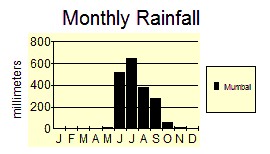
Arcmap Versions 9.2 and 9.3 allowed the user to graph using table headers (fields) and corresponding rows (see image below). At version 10 this capability was lost. Previously I called Technical Support for help reproducing my graph in Arcmap 10, incident #994010 and #1212208, but they were unable to reproduce it. In the previous version I could ‘Add to current selection’ or ‘remove from current selection’ individual entities, and the graph would update dynamically each time. This was clearly illustrated in the help documentation for version 9.2 (images attached). Please restore this functionality to Arcmap 10! Currently I have to operate in the office and in the field (on a vessel at sea) with two computers for the two different versions of the software. Help.
1 Comment
I believe that you meant the 10.x version of the software rather than only version 10 since that functionality is not persistent in the 10.x versions of the software.
You must be a registered user to add a comment. If you've already registered, sign in. Otherwise, register and sign in.