- Home
- :
- All Communities
- :
- Products
- :
- ArcGIS Pro
- :
- ArcGIS Pro Ideas
- :
- Replace and upgrade current reporting tools
- Subscribe to RSS Feed
- Mark as New
- Mark as Read
- Bookmark
- Follow this Idea
- Printer Friendly Page
Replace and upgrade current reporting tools
- Mark as New
- Bookmark
- Subscribe
- Mute
- Subscribe to RSS Feed
- Permalink
This is a suggestion to improve data reporting tools for feature classes and tables in ArcGIS
The Problem:
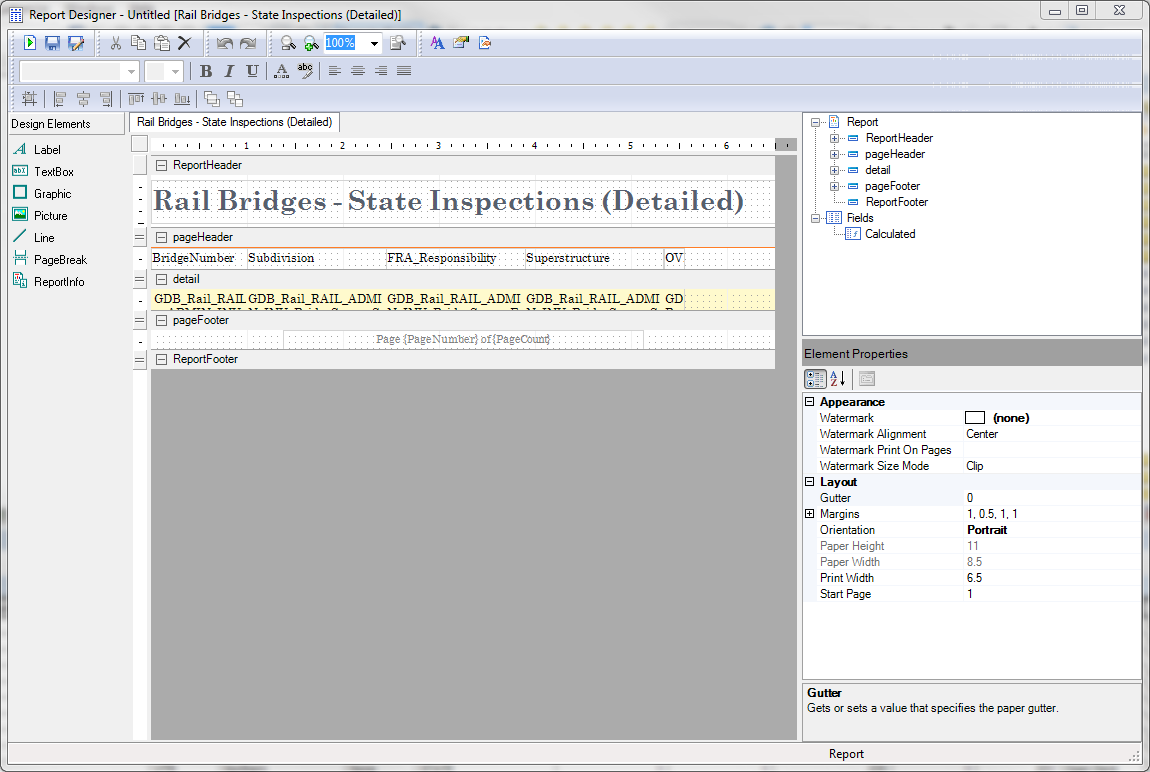
With more and more authoritative data housed in GIS feature classes there needs to be a way to generate repeatable, highly customziable, and easily configurable reports. Currently the table reporting tool is very anitquated and difficult to use.
This UI is basically impossible
The Solution:
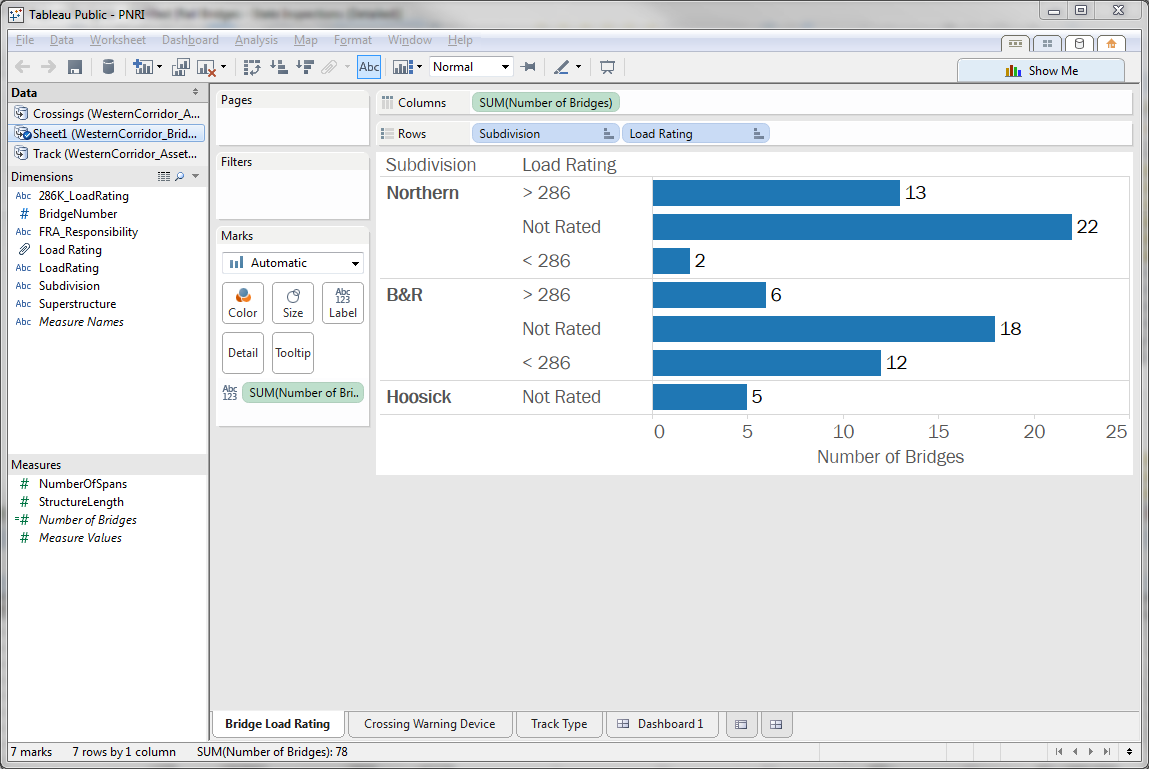
Implement a more modern, drag-and-drop report creation tool similar to Tableau.
I don't think that I could come close to creating this report using the current report tools
Benefits:
Many reporting tools have already been developed in the Operations Dashboard product. If those reporting tools (along with some more advanced configuration options) were migrated to a table reporting tool you'd have a lot of functionality already built.
Caveats:
If your organization is willing to shell out the money for Tableau you can use their reporting tools straight from Esri databases. However, we're paying so much for ArcGIS already it's only sensible to include usable reporting tools.
Hello Stephen Smith,
Thank you for submitting this idea. Please take a look at Insights for ArcGIS. It looks like Insights will offer the functionality you've outlined in your idea, and it will be part of the upcoming 10.5 beta.
Thanks,
Scott
And Reports in ArcGIS Pro will support charts in the next release (2.6): https://community.esri.com/ideas/17698
Hi @deleted-user-eL1mKkp8gJc9!
ArcGIS Desktop is deprecated and will be retired March 1, 2026 so we won’t be considering this idea. We recommend that you migrate to ArcGIS Pro, our fully supported desktop GIS application. See Keep Innovating with GIS for more information. Thank you for taking the time to share your ideas. We truly appreciate your contributions to continuously improving the software to help you do your work and look forward to what ideas you have for ArcGIS Pro.
You must be a registered user to add a comment. If you've already registered, sign in. Otherwise, register and sign in.