- Home
- :
- All Communities
- :
- Products
- :
- ArcGIS Pro
- :
- ArcGIS Pro Ideas
- :
- Gradient Fill / Glow Effect For Polygon Boundaries
- Subscribe to RSS Feed
- Mark as New
- Mark as Read
- Bookmark
- Follow this Idea
- Printer Friendly Page
Gradient Fill / Glow Effect For Polygon Boundaries
- Mark as New
- Bookmark
- Subscribe
- Mute
- Subscribe to RSS Feed
- Permalink
One of the things I've been doing for years with ArcGIS for polygon boundaries, whether it be counties, settlement areas, coastlines, etc., is to have what a graphic designer in a vector illustration package would consider a transparency blend effect on an object, be applied to any type of polygon. I apply this kind of affect to boundaries because I might want a colour that denotes a particular theme be visible to along the boundary of a polygon and dissipate as one moves inside the polygon. Typically when you have a thematic colour applied to polygons you can have issues discerning the boundary thematic colour when a neighbouring polygon shares the same geometry. If you have a transparency effect starting with 0 transparency at the polygon edge and going to 100% transparency at some distance inside the polygon then you can always see the thematic colour of that polygon regardless of adjacent polygons sharing that same geometry. In order to do this I've been using the multi-ring buffer tool on polygons, whether they be counties, urban areas, settlement regions, landmasses, etc. so that I can have a thematic colour scheme for polygons, while still allowing the underlying thematic elements, such as roads, lakes, or other elements be visible, but yet underneath this boundary layer. When I generate the multi-ring buffer, I make a transparency field having an increasing transparency value per interval (see below).
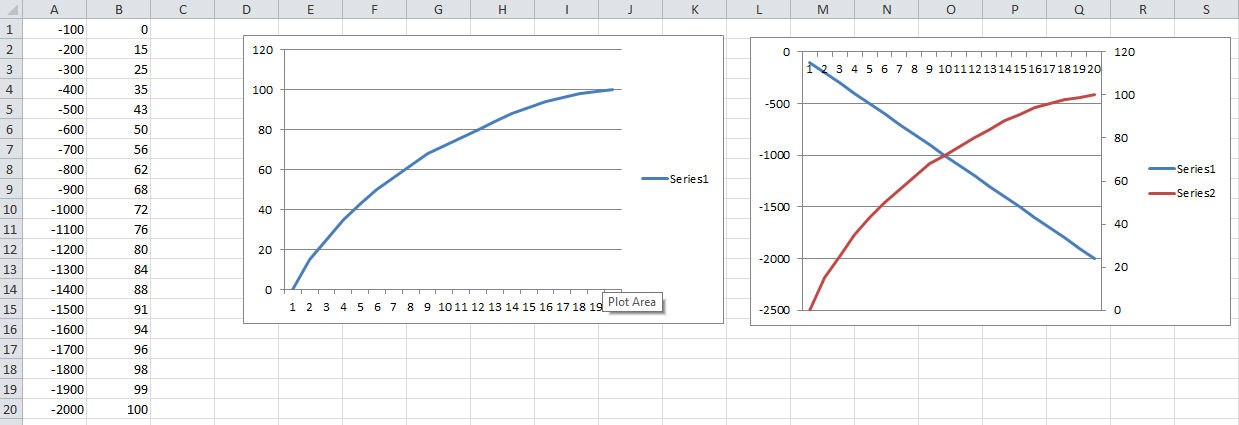
You can see that a linear curve doesn't look as nice as a the decreasing interval curve (red line) in the second graph.
I will usually create a non-linear set of transparency values so that I can have a curved transparency blend as one goes from 0% transparent to 100% transparent.
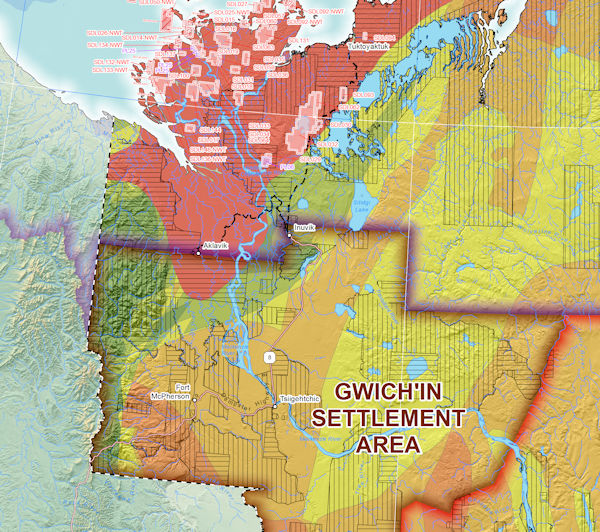
You can see an example of this on the map (Hydrocarbon Potential Landscape- 2018 Optimized PDF) on the following URL page: NWT Hydrocarbon Potential | Industry, Tourism and Investment
Here I use a white halo effect along the coastline, as well as have transparency effects for the three settlement regions/areas.
A small screen gab is below:
 ##
##
I use the white (it could be any colour) halo along a coastline to give a better blended effect between the land and marine data, it also helps when you have vastly different resolutions/scales of raster data, where there aren't exacting matches between the land and water. Putting in that halo/glow effect can hide issues that aren't quantitatively important for an analytical result, just the fact that you have only so many sources of data, and you have to use what you can get a hold of. Not everything can be solved by online streaming data sources, especially when you can't thematically symbolize the content the way you want to.
I create multiple sets of these multi-ring buffer transparency layers with zoom layering enabled for each set so that as I zoom in and out of a map I can have roughly the same distance of a gradient fill applied to the polygons.
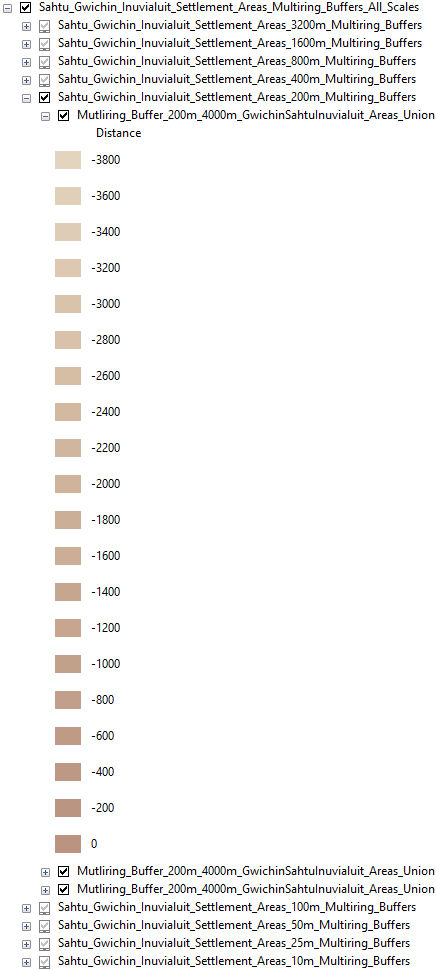
I've only expanded one of the groups, but the Sahtu (red) and Inuvialuit (purple), have the same look as the Gwich'in (brown). Yes this is a complex solution but works quite well to visualize maps.
I have to use a vector illustration software program, I use CorelDRAW (been using it for 25 years), to create a blend effect using the same colours as the settlement regions to create a PNG or JPG that I can insert into the layout in ArcGIS then add text for the description. Since there's no ability to generate a legend element from a multi-ring buffer layer effect like I've created.
It would be great if ArcGIS Pro could create this kind of thematic and build a legend element like I've done. Obviously I'm still going to be using the existing method, but thought that if enough people thought this was a worthwhile option for thematically symobolizing information or just for cartographic effect, then perhaps it could be added to a future incremental or full release?
Thoughts?
You must be a registered user to add a comment. If you've already registered, sign in. Otherwise, register and sign in.