- Home
- :
- All Communities
- :
- Products
- :
- ArcGIS Pro
- :
- ArcGIS Pro Ideas
- :
- Clear RAM/UI When Maps and Layouts Are Closed
- Subscribe to RSS Feed
- Mark as New
- Mark as Read
- Bookmark
- Follow this Idea
- Printer Friendly Page
Clear RAM/UI When Maps and Layouts Are Closed
- Mark as New
- Bookmark
- Subscribe
- Mute
- Subscribe to RSS Feed
- Permalink
I often have projects with multiple maps and layouts, most of the time in excess of 10 of each. I am opening and closing the layouts very frequently. I have noticed that the more maps and layouts I have ever opened during a pro session will degrade application performance significantly. For example, by the time I get to editing my 6th map and associated layout (I closed the first 5 maps and layouts once I was done with them), the Pro UI is pretty much unusable. The delay for any interaction becomes 30 seconds, or sometimes minutes. I then have to save and close the project and reopen it for the application to become usable again.
I have noticed this appears to be directly related to the number of items in the TOC ever opened during the session. I can have many maps with few layers, no problem. But if I have just a few maps with about 12-15 layers, everything slows down very quickly. Attribute tables becomes useless, interacting with the TOC is very laggy, etc. I notice at this point in task manager, Pro is using a great deal of RAM (in excess of 10GB sometimes) and every interaction can use up to 60% of my CPU, which is a lot for a 32 core beast.
Therefore, I believe there has to be a way to "clear" the Pro session for a map or layout that is closed. When you click the "x" on the map or layout, it should be unloaded from the RAM or what have you so you do not have to restart Pro every 5 maps/layouts you work with.
Entirely agree. If this is possible, it would be great. It may also help troubleshoot some things that normally require a reboot of the program.
@Jimmy_Simpson you've highlighted very well one of the many resource vacuums that Pro can be guilty of. I would propose that this be looped in with ideas that relate to performance monitoring as a whole, and would like to see the application have it's own in-session monitoring tools that show where resources are being consumed the most.
2 other examples I can think of off the top of my head are:
1. Models that have a lot of number variables can drain the CPU when the tool is opened.
2. Connected folders that have a lot of child folders in them can drain performance due to the indexing that occurs.
@David_Brooks have you worked with the built-in Diagnostic Monitor? Just wanted to make sure you were aware of that.
@KoryKramer ah, I hadn't seen this before. Was it new for 2.8? Will definitely give it a go. Very helpful.
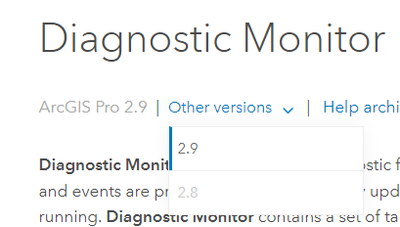
An earlier version of the diagnostic monitor had been available in Pro since the start, but more as a developer tool. It was overhauled with major improvements to make it more user-facing and informative for users willing to do some troubleshooting on their own. The improved monitor was released in ArcGIS Pro 2.9 (little trick, note that 2.8 is grayed out...):
You must be a registered user to add a comment. If you've already registered, sign in. Otherwise, register and sign in.
