- Home
- :
- All Communities
- :
- Products
- :
- ArcGIS Online
- :
- ArcGIS Online Questions
- :
- Re: Serial chart - remove null value graphing?
- Subscribe to RSS Feed
- Mark Topic as New
- Mark Topic as Read
- Float this Topic for Current User
- Bookmark
- Subscribe
- Mute
- Printer Friendly Page
Serial chart - remove null value graphing?
- Mark as New
- Bookmark
- Subscribe
- Mute
- Subscribe to RSS Feed
- Permalink
Hi all - looked for an answer to this but I can't find the right one. Seems basic - I have a serial graph (line) shown below. I have several time periods during which data wasn't collected (gaps). In the spreadsheet, those are blank cells (graph is based on a CSV I upload as a hosted layer). I don't want to show the blank values as this misleads the viewer into thinking that there was a drop in concentration - when in fact I just don't have data for that time period.
I tried using a filter for null values but this didn't give me what I was looking for - perhaps I'm doing it wrong? Also, this seems like a basic thing - don't interpolate between values (it's not set up as a 'smoothed' line type). Just don't show anything. Can anyone help? I'd share the actual dashboard, but it's for a client that doesn't want that to happen. Thanks in advance.

- Mark as New
- Bookmark
- Subscribe
- Mute
- Subscribe to RSS Feed
- Permalink
To fix this for my serial chart I added a category selector to a header. When I configured it I loaded the categories which did not pull in the blank or the null values. Then I added an action to filter my chart.
- Mark as New
- Bookmark
- Subscribe
- Mute
- Subscribe to RSS Feed
- Permalink
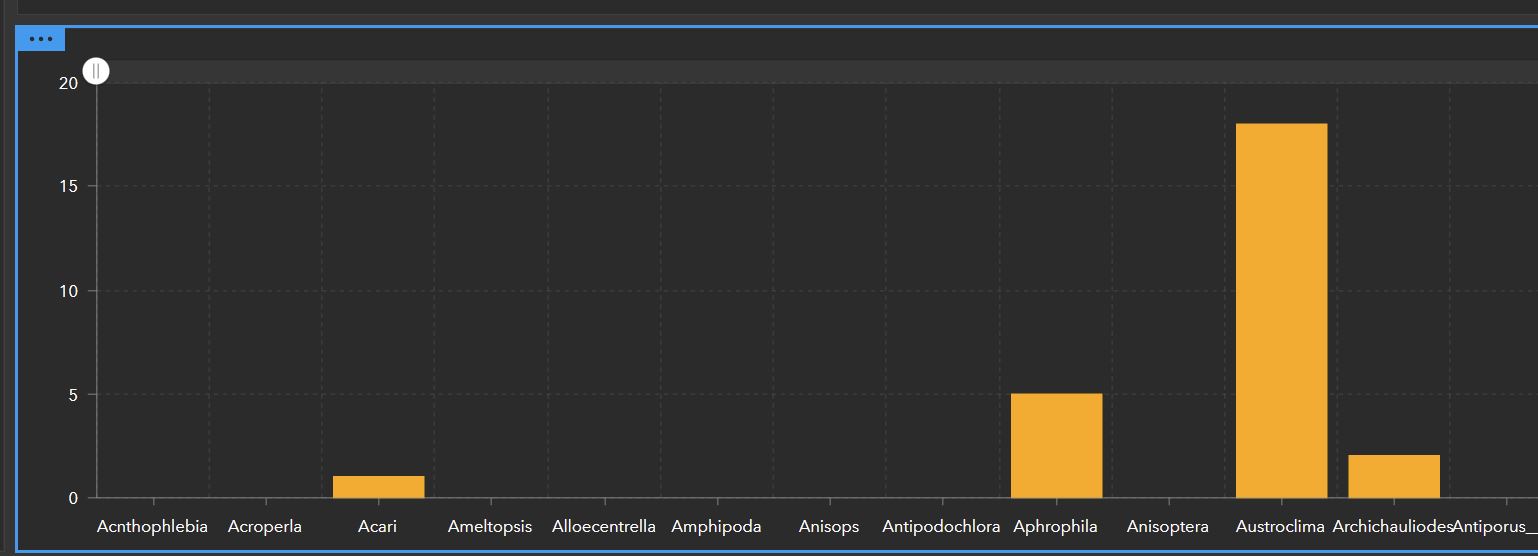
I have a similar issue with a bar chart. It is for species count and I do not want to show the species in the chart if the count is null. It's very similar to what can be done with the pop-ups in not showing values if they are null. Is there a way to exclude bar chart categories from the x axis if their value is null? This is being used in combination with a category selector btw.
- Mark as New
- Bookmark
- Subscribe
- Mute
- Subscribe to RSS Feed
- Permalink
Hello, I have a similar issue now. Were you able to find a suitable workaround?
- Mark as New
- Bookmark
- Subscribe
- Mute
- Subscribe to RSS Feed
- Permalink
Did you try the solution I posted in my Update? See below perhaps. Basically I delete the zeroes, they come in as true NULLs in Arc, then you toggle Connect Gaps OFF. Voila.
- Mark as New
- Bookmark
- Subscribe
- Mute
- Subscribe to RSS Feed
- Permalink
Update:
So this is what I did to 'fix' this issue.
Where I had '0' values, I delete them - so they are 'null'. Then when setting up the Serial Chart under 'Series' for each data category to be charted, you simply click the 'Connect Gaps' toggle to off.

It's unfortunate that there isn't a setting to ignore zeroes or something - but this works perfectly well and could be done in Excel or what have you.
- Mark as New
- Bookmark
- Subscribe
- Mute
- Subscribe to RSS Feed
- Permalink
Hi! I've got the same issue but it looks like the "Connect Gaps" toggle is no longer an option in the serial chart. Have you experienced this as well? Thanks!
- Mark as New
- Bookmark
- Subscribe
- Mute
- Subscribe to RSS Feed
- Permalink
Hi - I just checked this out to see if it had changed - it has not (at least for me) - see below for a screenshot from today of my serial chart setup options from my dashboard. The Connect Gaps toggle is still there - you have to go into the settings for the chart, choose 'Series' and then choose the dataset for which you want to toggle 'Connect Gaps'. Should be right below the chart 'Type' option. Hope this helps.