- Home
- :
- All Communities
- :
- Products
- :
- ArcGIS Online
- :
- ArcGIS Online Questions
- :
- Portal Feature Symbology based on Related Table
- Subscribe to RSS Feed
- Mark Topic as New
- Mark Topic as Read
- Float this Topic for Current User
- Bookmark
- Subscribe
- Mute
- Printer Friendly Page
Portal Feature Symbology based on Related Table
- Mark as New
- Bookmark
- Subscribe
- Mute
- Subscribe to RSS Feed
- Permalink
I see that, in Portal, I can add a count of related tables to a point feature's pop-up in the map.
I have a point feature with two related tables, one for investigations and one for repairs. Is there not a way to symbolize the point feature based on the related table record count? Something like:
Symbolize the feature this way if # of Investigations is 0 and # of repairs is 0
Symbolize the feature this way if # of investigations is > 0 and # of repairs is 0
Symbolize the feature this way if # of investigations is > 0 and # of repairs is > 0
I know I've seen other discussions stating you can't symbolize based off related tables without some scripting, but it seems like if I can add it to the pop-up, I should be able to use that info to symbolize as well; however, that doesn't appear to be the case when trying to change the point's symbology.
- Mark as New
- Bookmark
- Subscribe
- Mute
- Subscribe to RSS Feed
- Permalink
Hi Jason,
I haven't tested this with related data, but you could try an arcade expression to do this. For example:
if ($feature["Investigations"] == 0 and $feature["Repairs"] == 0){
return '0'
}
else if($feature["investigations"] > 0) and $feature["Repairs"] == 0){
return '1'
}
else if($feature["investigations"] > 0) and $feature["Repairs"] > 0){
return '2'
}You can then symbolize based off the new field that is created using Unique Values.
- Mark as New
- Bookmark
- Subscribe
- Mute
- Subscribe to RSS Feed
- Permalink
Not sure if that will work, since there is no field in the point feature that relates to investigations or repairs.
Here's a screenshot of the related table count in the pop up (bottom two values); however this info isn't available to symbolize off of.

Also, here's a screenshot of the data tab of the point feature layer. Is there a way to tap into these related table fields to symbolize (I'm assuming no).
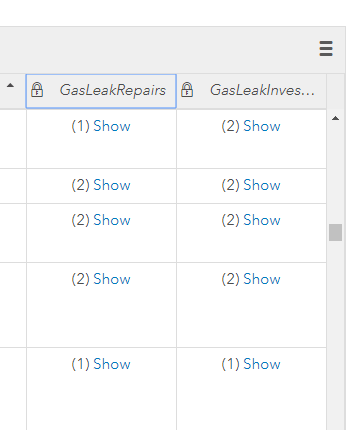
The easiest (and maybe the only?) solution I can think of is to add a couple of Y/N fields to the point feature called "Investigated" and "Repaired". In addition to adding a related table to the point feature via Collector, the field user would also have to edit the point and select Y for whichever function they were performing (an investigation or a repair). Then it'd be easy to symbolize based off this field; however, it creates some additional steps for the field user; since to add a related table to the point, you don't have to edit the feature.
- Mark as New
- Bookmark
- Subscribe
- Mute
- Subscribe to RSS Feed
- Permalink
You're correct. It doesn't look like you can tie into related fields, but it appears this functionality is coming:
- Mark as New
- Bookmark
- Subscribe
- Mute
- Subscribe to RSS Feed
- Permalink
Could a script be written that would auto-populate a 'Last Inspected Date' and a 'Last Repaired Date' attribute of the point feature with the dates from the most recent related tables? When a point is added, these attribute values would be null, but once a related table was added, the date would auto-populate with the date entered on the related table. Then you could symbolize based off that attribute field (if the last inspection date is null, color is red - if last inspection date is > 0, color is orange - if last repaired date > 0, color is green).
- Mark as New
- Bookmark
- Subscribe
- Mute
- Subscribe to RSS Feed
- Permalink
A script could be written to do this, but you would need Windows Task Scheduler to execute it on a given interval (i.e. execute the script every 30 seconds to check for related records). GeoEvent is a solution for real-time GIS that will perform an action as soon as an update occurs.