- Home
- :
- All Communities
- :
- Products
- :
- ArcGIS Online
- :
- ArcGIS Online Questions
- :
- Re: Pie Chart Operations Dashboard
- Subscribe to RSS Feed
- Mark Topic as New
- Mark Topic as Read
- Float this Topic for Current User
- Bookmark
- Subscribe
- Mute
- Printer Friendly Page
- Mark as New
- Bookmark
- Subscribe
- Mute
- Subscribe to RSS Feed
- Permalink
Hello all,
I am working on creating my first dashboard in AGOL and I'm wanting to filter my data to create three slices. I have a field called avg_daily_boardings associated with our system's bus stops and I'm hoping to use three filters:
avg_daily_boardings equal 0
avg_daily_boardings between 0.01 and 4.99
avg_daily_boardings greater than or equal to 5
The end result I want is three slices that show how many bus stops are in each category. Is this possible?
Solved! Go to Solution.
Accepted Solutions
- Mark as New
- Bookmark
- Subscribe
- Mute
- Subscribe to RSS Feed
- Permalink
I ended up making a new field called Shelter Requirements because that's what I was trying to show with those values. I used a When() statement to calculate the values for the new field and it gave me what I wanted. Thanks for all the help!
- Mark as New
- Bookmark
- Subscribe
- Mute
- Subscribe to RSS Feed
- Permalink
Miguel,
You should be able to do this. It's a simple filter that you would create for each of those categories within Ops Dash. Have you tried it yet?
Here is an article on how to filter your data
Filter data—Operations Dashboard for ArcGIS | ArcGIS
tagging:
- Mark as New
- Bookmark
- Subscribe
- Mute
- Subscribe to RSS Feed
- Permalink
I think I might have to do what Katherine suggested. When I try to use a filter for a range of values, I get a slice for each value, see attached image. 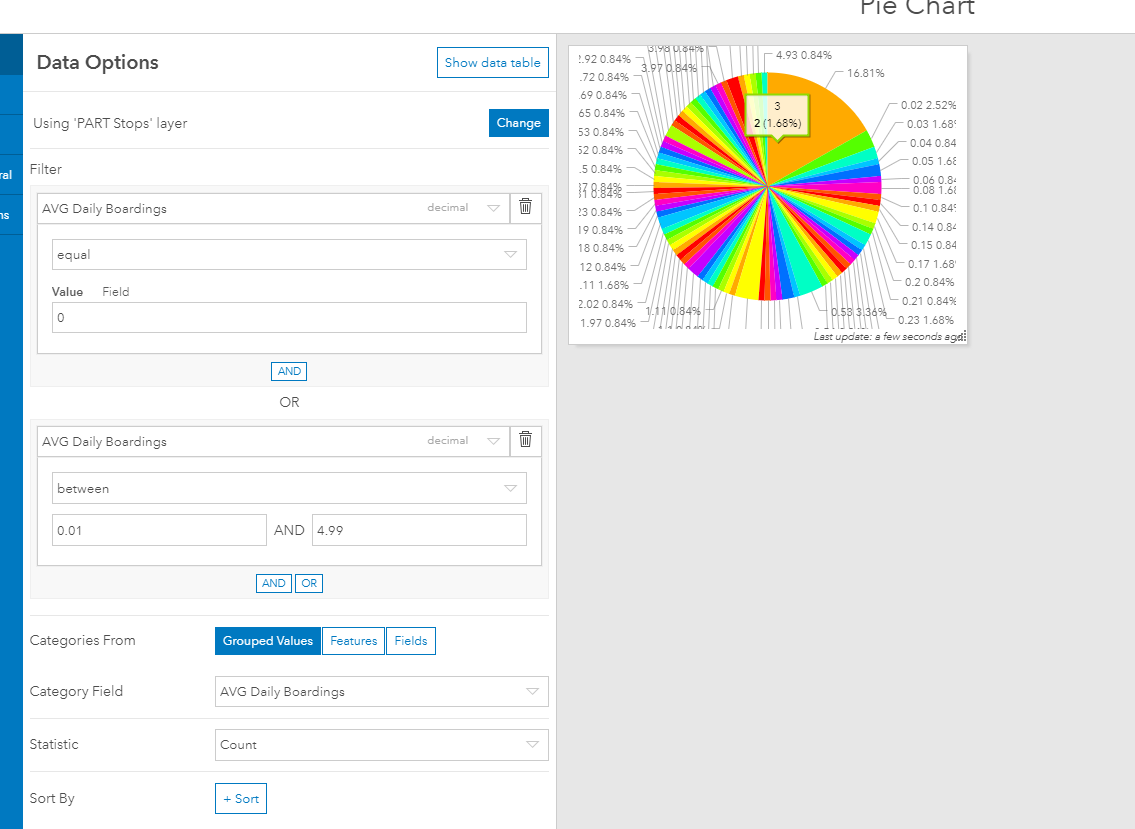
- Mark as New
- Bookmark
- Subscribe
- Mute
- Subscribe to RSS Feed
- Permalink
Hmmm...my first thought would be to create a new field in the feature layer and use the field calculator to do something like assign a value of 1 if avg_daily_boardings = 0, a value of 2 if avg_daily_boardings between 0.01 and 4.99, etc. Then create the pie chart based on this new field and change the labels under the "Slices" tab when configuring the dashboard to make the pie chart look like how you want the end users to see it.
I'm new to Ops Dashboard as well, so maybe someone else has a more efficient approach?
Katie
If this post helped you, please consider giving a kudos and/or marking as the accepted solution. Thanks!
- Mark as New
- Bookmark
- Subscribe
- Mute
- Subscribe to RSS Feed
- Permalink
Hmm, after looking at it more, it doesn't seem to be as easy as just filtering the data. I think I would be against a new data field just for the sake of showing the same data. I wonder if you could make a custom expression in ArcGIS Arcade and then just display that arcade expression field. That might work better since you wouldn't have to create a new field:
- Mark as New
- Bookmark
- Subscribe
- Mute
- Subscribe to RSS Feed
- Permalink
Okay, I'll have to give that a try in the morning. Thanks for your help.
- Mark as New
- Bookmark
- Subscribe
- Mute
- Subscribe to RSS Feed
- Permalink
I ended up making a new field called Shelter Requirements because that's what I was trying to show with those values. I used a When() statement to calculate the values for the new field and it gave me what I wanted. Thanks for all the help!