- Home
- :
- All Communities
- :
- Products
- :
- ArcGIS Online
- :
- ArcGIS Online Questions
- :
- Operations Dashboard Incorrect Counts by Record
- Subscribe to RSS Feed
- Mark Topic as New
- Mark Topic as Read
- Float this Topic for Current User
- Bookmark
- Subscribe
- Mute
- Printer Friendly Page
Operations Dashboard Incorrect Counts by Record
- Mark as New
- Bookmark
- Subscribe
- Mute
- Subscribe to RSS Feed
- Permalink
I am experiencing a strange issue with the count statistic in operations dashboard in AGOL. The resulting counts of records for a table after a query is producing the incorrect number. For example, if I wanted all the inspection reports completed for this year by inspector I get different results in the bar widget then the data table view. i.e I get a return of 5 records in the data view (which is correct) and a value of 11 in the bar graph for one inspector.
The table is related to a feature class in the database via relationship class, and published as a feature and map service from ArcGIS Server 10.3.1.
I spent some time investigating and I have found a strange issue with ObjectID. If I do a query of created date in past year and officer x, with Category field as ObjectID and Statistic as "count" I get this result:
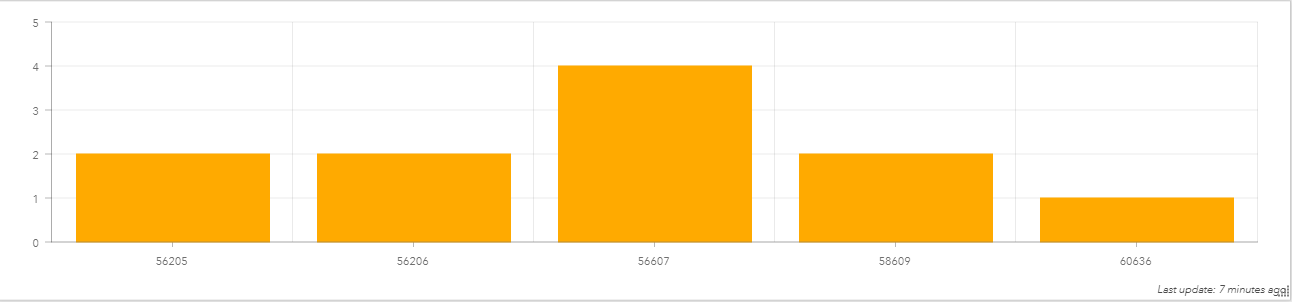
You will notice that the number of ObjectID records is 5, yet the count for each ObjectID is more than 1. The total adds up to 11, which is what the bar graph shows:
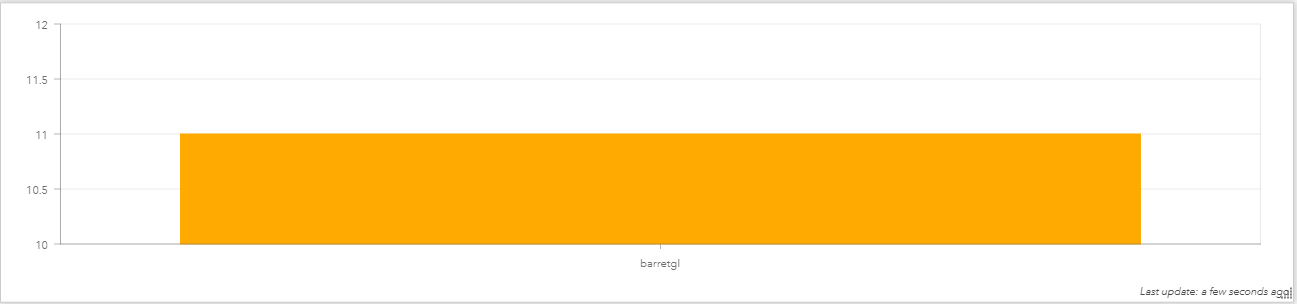
How can I get the bar graph to show the correct count of 5?
- Mark as New
- Bookmark
- Subscribe
- Mute
- Subscribe to RSS Feed
- Permalink
There are some posts about incorrect record counts in OD when hitting an SDE database due to adds and deletes being included. You should be able to search for this in GeoNet.
- Mark as New
- Bookmark
- Subscribe
- Mute
- Subscribe to RSS Feed
- Permalink
- Mark as New
- Bookmark
- Subscribe
- Mute
- Subscribe to RSS Feed
- Permalink
Does this mean you cannot use a operations dashboard with a feature class that has attachments? All of my indicators are incorrect by a significant amount querying on several different fields.
- Mark as New
- Bookmark
- Subscribe
- Mute
- Subscribe to RSS Feed
- Permalink
The issue was related to the edit/archiving tables. The fix was to include this line in the SQL Views:
WHERE x0.gdb_to_date > '9999-10-10 10:10:10'
- Mark as New
- Bookmark
- Subscribe
- Mute
- Subscribe to RSS Feed
- Permalink
The solution in this post refers to removing attachments (with doesn't exist on my table) and the relationship, which is not an option for me.
I will investigate the option of using a view for reporting instead.